CAT ShortEntry @ 136.73 Stop @ 140 and Take Profit @ 129.
30 shares.
Max loss is $98.1 max profit will be at least double that if it breaks support at 129 I'll add to it and hold for another $3.
98.1 is less 0.981% capital less than 1%. Good Risk and reward.
Reasons for the trade - Divergence from Range previous to the breakdown as the reversal began that's 1+ point.
Volume in sell off and earnings were mediocre. Trending below 20/50 MA. +3
Grade A Trade. Should work out well.
Let's see how it pans out.
FB active with $6282.9 of capital// Roku active with $3807 // CAT active with 4101.9// with remaining of $5808.2 remaining. All Shorts.
3/100 on the 100 Trade Challange.
CAT trade ideas

$CAT at VPOC$CAT right at VPOC (volume Point of Control). Caterpillar Inc. is scheduled to report fourth-quarter 2019 results on Jan 31, before the opening bell.

Neutral on Caterpillar
Sentiment quite poor
Price action negative since November, lacking volume.
Nice ARCH on weekly, well respected, $130 as support possibly falling to $126.
China a obvious issue which is now compounded by Flu Virus.
Copper also worrying for long term perspective.

Head fake in works?Expanding flat, 3-3-5 with it holding around the 161%, which is known to finish around that ext.Ill be a buyer tomorrow. ER on Friday.


CATERPILLAR (CAT): Bearish Forecast
CAT yesterday broke below key structure support.
the breakout is considered to be confirmed and the current forecast is bearish.
price may recover a bit and then retrace from the broken level.
key target levels will be 130.0 / 120.0

CAT MovementPossible ascending wedge.
Either a big pop coming soon or a big drop. I'm thinking we see a fake out break down and then power through to new 52 week highs. If a drop could see $141 or lower.
RSI negative divergence, but thinking we could turn around on it, Blue dashed line shows an area with some reversals on the daily RSI that could offer support.
A/D in uptrend, could see small drop minimal with a bounce off trend line or it could tank time will tell.
MFI getting squeezed in symmetrical triangle, formation started in uptrend so expecting it may exit in uptrend.


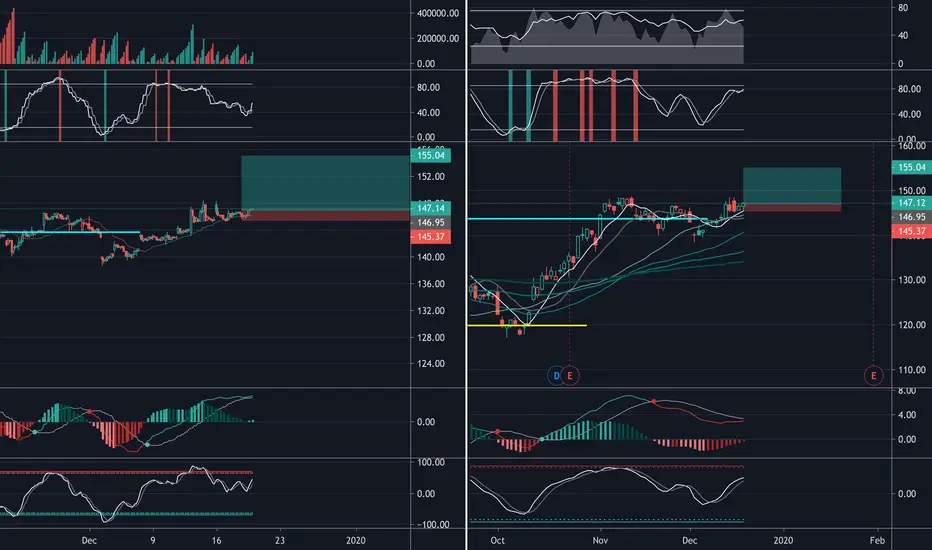
CAT ShortI'm shorting cat with a stop loss at 1% @ 147.60 it may continue a bit lower my target exit will be 144.60 with my entry at 146.60. Making 2% if it passes the 50 MA I may add and continue holding for a few more % points.
Divergence on RSI could move lower, however it may still bounce at 50 MA.
Earnings Jan 31, I will exit before then.


Long Idea - Industrials2/Jan/2020 09:43 AM AUTHOR: Brandon Gum
--
~2.5RR
Not sure how to align this idea with where were are in the economic cycle - Lack of knowledge concerning the business cycle and when typically one wants to be buying industrials.
======================


CAT - potential breakout even further?CAT recently broke upward. There may be opportunity for continuation.
With Christmas near, let's wait and see what happens in 1-2 weeks.
Zooming out to a wider, longer-term view also shows potential for a longer-term trend move


Adam Eve Cup of Tea! I see a nice break of this flag range, Im feeling a stretch punch after this nice W formation with a possible cup but from there we need to be caution around tp1 & tp2. A horizontal range can begin around the caution orange circles. Orange eye represents us to be watchful.
It seems on the hourly we are expanding and collecting orders in order to get that next push up. It is possible to revisit the purple horizontal line depending on fundamentals.
Price is holding above red ribbon
Should CAT go bearish upon tp1 zone and go bearish around spring through fall of next year, I feel it will be the last time we visit 100 for a long time and we will make our way to 200. This would give us an ABCD pattern breaking the daily low @ purple circles.
Orange - watchful
Red - Sellers are watching
Blue - Buyers are watching
As long as we stay above 142.00 I see us staying bullish. A break below that will take us to a 140 retest and buyers will be watching for impulses. This kind of scenerio would create an INV head&shoulder formation on the daily and have the onion effect of a slanted version on weekly marked by the green shoulder circles and take us to the 78-88% fib correction zone where "head" formations can form. This would also lead into a new flag formation outside the daily flag range we just broke out of creating a new trend.
As always please trade safely, manage risk, peace. love. trade.


CAT is able to reach the previous resistance price is moving towards the green zone on the A trend line, we can consider the movement to be bullish until B trend line it's not broken

CAT nyse Long (how to use the RSI in a slightly different way)NYSE:CAT
CAT Nyse is looking to continue the push to the upside after breaking the downward Trend, I took the depth between the low and the downward trend and projected a price target. After a higher low and a Higher high which is clearly shown on the chart gives us a better probability that a continuation move is expected to the upside.
Also if we look at the RSI, the indicator has pushed into the boundaries of the oversold area suggesting a strong bullish stance as shown on the green box, before it was consistently hitting the oversold area as shown in the red box which is translated to continued weakening.
Price is currently trying to find support on the 140.50 which is considered strong support.
If buyers are able to maintain price above this support, the bulls can be expected to take price towards the 156.50 level as a target
In regards to the RSI, one way to use it besides the divergence method is that as the indicator continues to push within the oversold it means that the negative stance is expected to continue and vice-versa of course, this helps when price sometimes gives us a hard time to speculate if it indeed reversed into a positive stance from a negative one.
