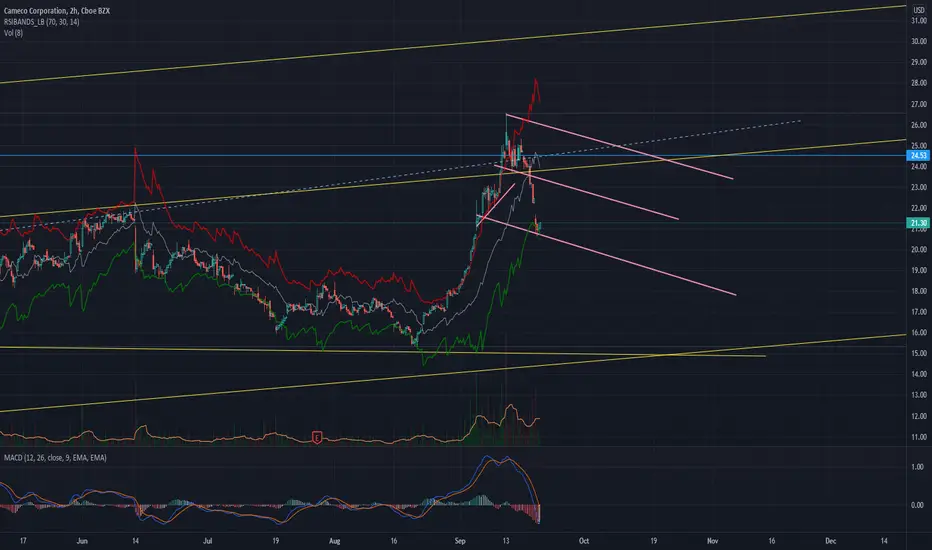
CcjAre we there yet? Not sure. Got the make off a bullflag though. Falling wedge and a little o bearflag dropping her to 19.5 and see then….
Most bullflags have a waistline that’s midway between top and bottom rails so if you acan see the waistline, you can project a floor. Ccj is tricky but that’s my best guess for now.
CCJ/N trade ideas

$CCJ Vs Uranium UX2!rapid backtest has sent the RSI70 SOARING
Backtest back to the VPVR and wasteline of the bullflag
See the UX price arcing up with teh CCJ: UX
Nice entry? If you look at the chart, I'd think so.. just want a smidge more conirmation of current local stucture.
I'm LT HODL CCJ LEAPS so...

CCJNice ledges there and setup for a bullflag on the BO line.
gaps down nice and bullish. Clearing teh decks of sellers so FOMO can take over again.
CCJ /are we destined to repeat the past?(pt2) target low as 18?what do you think of CCJ by mid october..november-ish?
i think (for now) a continued down trend. not sure about 18 but...
seems my earlier prediction might come to forreston. ~link below~

what do you think of CCJ? short term. down as far as 18?what do you think of CCj by mid october, novemberish? i think (for now) continued down trend.
i charted this head and shoulder pattern before break out, link it below.
var tradingview_embed_options = {};
tradingview_embed_options.width = '640';
tradingview_embed_options.height = '400';
tradingview_embed_options.chart = 'fFJ3VWfd';
new TradingView.chart(tradingview_embed_options);
CCJ... are we destined to repeat the past? by Benz951 on TradingView.com

uranium minerwheres she going.................................................................................

Cameco - UraniumWe like the uranium play and we are doing it through Cameco. Sell target at 1.618 Fib level.
We are not early to this play, it has been underway for quite a while. We may be approaching the top, but we want to squeak a bit more out of it.
Other plays are the Sprott Physical Uranium Trust and URNM .
Fundamentally, Sprott is cornering the physical market.
adventuresincapitalism.com
Get some!

CCJ, Buy stop set Looks like Uranium is pulling a lumber and that could produce a similar trend for uranium based trends . Fairly bearish price action yesterday on CCJ , so I think today will say a lot, pre is up . I set a buy stop at 25.75 , will buy a starter if price can come into yesterdays wick and throw a stop under the candle . If trend maintains its current success I will keep adding to the position using similar tactics .

CCJ 9/12/2021Cameco Corp (CCJ)
Sector: Non-energy Minerals (Uranium)
Current Price: $24.43
Breakout price trigger: $23.20 (hold above)
Dip Buy levels: $23.15, $22.50, $22.00
Price Target: $26.00-26.20
Estimated Duration to Target: 1-3 days
Contract of Interest: $CCJ 9/17/21 25c
Trade price as of publish date: $0.79/cnt

$CCJ 300% Rise Incoming?Sorry for the click bait, but now that you are here...
$CCJ has been on a tear over the last few weeks. The stock is up 60%. Longer term (not shown) you can see that there is potential for this stock to absolutely soar; we cannot rule out the stock returning to its previous highs from 2007 when it hit $56.
But for the disciplined objective technical analyst, the one I am trying to speak to in this idea, the immediate question is one of immediate price action. After rising this fast, how much meat is there left on the bone before overbought readings push intermediate traders to take profits in this rally? We can see that the DMI is showing an elevated reading that, in previous instances, indicates that the immediate upside is likely contained. We can observe that in those instances the stock did resolve higher, as it was still in a longer-term uptrend, but it did so after much uncomfortable volatility.
So I am not bearish or bullish, I am just observing and would observe that immediate upside may be limited.
To watch the full video, check out my Youtube Channel for a full explanation.

CCJ - daily short specially 22.34 to 22.74
first target 20.12
second target 18.26
stop loss closing above 23.12


CCJ CAMECO CORP$CCJ -Daily - Breakout of parallel channel with 5 bottoms. Small pullback is healthy but Tuesday is possible gap up. #uranium

Uranium Sector Ready to RunCCJ has bottomed on W4, on its first impulse to W5, one more decent pullback remaining if true.

Added to $CCJ New Target 20.72 for 19.15%$CCJ Target 20.72 for 19.15%
Or next add at 16.02
-----
—
On the far right of the chart is my Average (Grey) Current Target (Green), and Next Level to add (Red) Percentage to target is from my average.
ONLY ADD at support levels & FIB levels… labeled
I start every position with .5 - 1% of my account and build from there as needed and as possible.
I am not your financial advisor. Watch my setups first before you jump in… My trade set ups work very well and they are for my personal reference and if you decide to trade them you do so at your own risk. I will gladly answer questions to the best of my knowledge but ultimately the risk is on you. I will update targets as needed.
GL and happy trading.

CamecoIn this video I will provide you with an broader picture of the Cameco chart and I am going to show you were I see good entry points to go long

🟢 Added to $CCJ Target 21.26 for 18.57% (Risk Level - Med)🟢 Added to $CCJ Target 21.26 for 18.57% (Risk Level - Med)
Or double position at 15.94
-----
—
On the far right of the chart is my Average (Grey) Current Target (Green), and Next Level to add (Red) Percentage to target is from my average.
Numbers with an A are places that are a good idea to add if you can.
Numbers with a D are places where you should double your position.
I start every position with .5 - 1% of my account and build from there as needed and as possible.
I am not your financial advisor. Watch my setups first before you jump in… My trade set ups work very well and they are for my personal reference and if you decide to trade them you do so at your own risk. I will gladly answer questions to the best of my knowledge but ultimately the risk is on you. I will update targets as needed.
GL and happy trading.

Uranium Sector UpdateSince I get a lot of questions about my UUUU positioning, I thought I would take a moment to see what the wider sector looks like. Keeping it simple looking at CCJ as the big papa.
Looks like there is some time left for correction into August. Timing is not reliable here, but the levels are significant.

CCJ: Timing the DipIf you've read my recent posts about CCJ you already know I'm long term bullish on Uranium but am waiting to buy the company at a more reasonable price. Based on my theory that we may be repeating the scenario of a long term breakout and correction as happened many years ago (see chart), then we want to look at potential zones of support to buy. Based on the Fibonacci retracement tool, the last scenario had a correction to the .618 zone, which corresponds to a price of ~15.50 per share. the 200 day moving average is a bit higher, so depending on market conditions I may average in if we start to see a test of the 200 day MA with the expectation that it could go lower.

CCJ$CCJ - the way I see it we have 2 possibilities here. 1. We move upwards from a current support line - bull flag formation. 2. We drop to around $16 - Stoch and RSI extreme oversold, creating Head Shoulder pattern - you know where it goes after that. #1 possibility is more realistic but not excluding #2. Good luck

CCJ CAMECO CORP$CCJ - looks like a strong support on both RSI and Stoch. indicator. IMHO I doubt significant downside is possible here. Just like $DNN Ichimoku CLoud is intact regardless of this #uranium spoofing.

CCJ CAMECO CORP$CCJ $24 target price by the end of August based on recent drops and advances. Note similarities in white circles.

CCJ CAMECO CORP$CCJ - 04/21/21 and 06/21/21 - similarities. Ichimoku Cloud is intact. VPVR - points out for $19.33 and $21.38 #uranium
