Ascending Triangle - Daily ChartYou can see an accending triangle forming. Best entry position here is mid-bullish engulfing pattern. We'll keep an eye on this pattern and look for an entry signal. Just another stock option strategy used a stockkingoptions.com NYSE:COF where we'll look to call a trade in one of our Trading Rooms.
COF trade ideas

Capital One Financial Corp (COF - US) - ABC wave patternCapital One Financial Corp (COF - US) is in ABC zigzag pattern and moving down as under-performer than SPX. It’s now moving down in C wave. Wave 2 is about to complete and wave 3 will start soon.

COF (US) - sell for 5th wave downCOF (US) is in downtrend and 5th wave is in progress. Sell with stops above 62.94 for target below 40 level.

$COF: Breakout and pullback is complete, Breakout and pullback is complete, ready to bounce, Target $77-80

COF - DAILY CHARTHi, today we are going to talk about Capital One and its current landscape.
As nowadays we live in a consumerist society and access to a credit card has continually become easier to obtain, is reasonable to predict that the card debts are also going to rise too, as financial education isn't the strong point of U.S consumers, and are used to the debt culture.
The heat up U.S economy put credit card companies in a more comfortable zone as the unemployment rate remains near to historic lows, which helps customers to keep up with their bills. However, the question that worth to be raised here is, if the 90 days past due card debt is probably surging to 2.01%, the highest level since 2010 amid a heated economy, what is going to happen with this type of debt, once the U.S economy make its first downward movement of correction and make harder for customers pay their credit card bills. Even with the credit card issuers tighten their credit standards, we can't be sure it's going to be enough to avoid a crisis on the sector, which could lead to a flood of bad debt, decline of new credit card issuance and other types of liabilities. This scenario could mean concerning news for Capital One if the company doesn't progressively start to deploy the proper countermeasures for this scenario.
Thank you for reading and leave your comments if you like.
To have access to our exclusive contents, join the Traders Heaven today! Link Below.
Disclaimer: All content of Golden Dragon has only educational and informational purposes, and never should be used or take it as financial advice.

Capital One data breach means nothing - BullFundamental Analysis
It appears Capital One isn’t the only company affected by this--it’s just the first company to publicly acknowledge it has been hacked and the most proactive in addressing the security situation. Meaning... as soon as other companies report the same, they will get the bad attention.
Because of the breach they will lose $150M-300M, which is nothing for this size of a bank.
The real impact might be more of sentiment towards the stock though.
Equifax very recently had a much more significant breach, and the stock just brushed it off.
Technical Analysis
Watch the SMA(50) as support.
OBV and RSI=52, did not reach dangerous levels on this drop.
MACD did cross below the signal, but it is on its way up.


Capital One Long if Ichimoku clud in the 4 hour chart resistNice ascending channel since January lows, if it holds this trend line and stays above the ichimoku cloud in the 4 hour hour chart I expect a 95$ target in the short term. It also depends on the performance of JP Morgan tomorrow since it will give guidance to the banks. I like Capital one because is a mix of Fintech with banks so it have better prospects of doing good in the future.

RetracedWe saw a short term retracement of the rise from 79.42. This has endet now. And as the previous high at 80.60 has been exceeded already a continuation of the rise seems to be more likely now.


Wells fargo market structureThis is just a quick one.
They recently had several billions dollars in money laundering violations and fines. The big red candle was the resulting sell off. it sold off to exactly the 50% of the last low.
the "bounce" from the over reaction is already at the 50% fib, which is usually where i would look to take off a short term position
For now and without researching more current business prospectus , i would watch to see how either the near term order blocks behave.
no clear trade on the high time frame.
stoch is indicating an attempted reversal but that could be in reaction to gain mentioned above (as the sell off was is what caused the resulting signal line impulse to the lower level.

$COF - Financials in general just... weak For me, and only using 2018 as a reference - the financials have 100% been a leading indicator for the market. If you don't agree - you can peep my $GS post from August 2018 because there really isn't an argument. Seeing as each chart I've looked at has just about the same correlated pattern - just decided to post the one with the best R/R. Without even forecasting some crazy bearish move - even a -4% move could seem like a "pullback" to bulls or the start of another December for bears. Either way - I don't see a way out of this one for $COF without touching a PT of mid $76.There's plenty out there to be bullish on but, I'm just not seeing it with the financials rn.


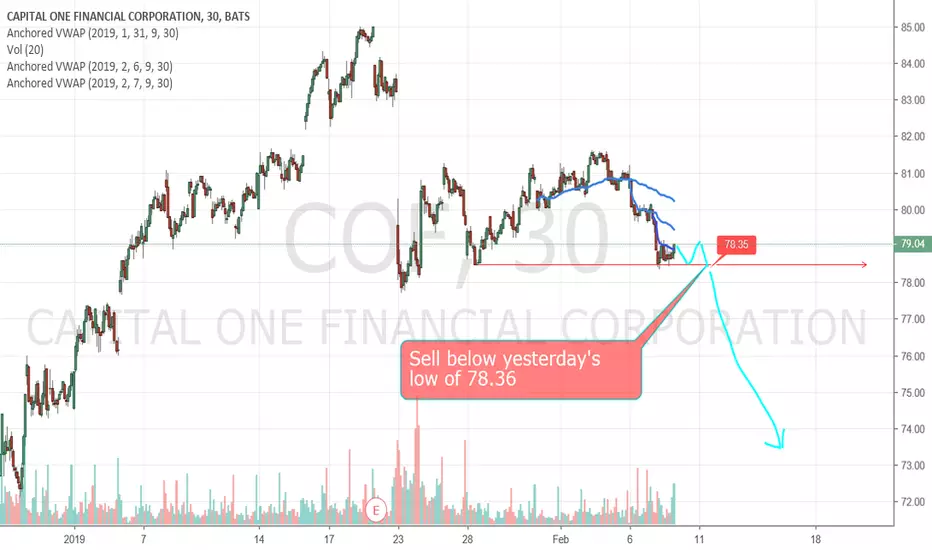
***Nice short candidate***Sell short below yesterday's low. See the chart for more details.
Please like, comment and follow if you like my ideas. THANK YOU!!!
Please note that this information is not a recommendation to buy or sell. It is to be used for educational purposes only.
DMI COF Jul-Sep 2013CALCULATING +DM and -DM
=========================
Up Move = today's high – yesterday's high
Down Move = yesterday's low – today's low
if Up Move > Down Move and Up Move > 0,
then +DM = Up Move, else +DM = 0
if Down Move > Up Move and Down Move > 0,
then −DM = Down Move, else −DM = 0
CALCULATING +DI and -DI
=======================
+DI = 100 times the exponential moving average of +DM divided by average true range
-DI = 100 times the exponential moving average of -DM divided by average true range


COF - Long IdeaWith markets resuming their uptrend and S&P/DOW playing catch up, financials/banks might get a push. COF looks ready for a breakout.


$COF Downtrend Breakout and Retest$COF Capital One appears to have broken through resistance. Possible medium term targets on chart.

COF: going long again.Was stopped out after previous post at 92.1. Now getting support at just about the level I have labeled "1" at 88.24. Some increase in volume last few days with a potential bullish diverge in the daily RSI. Going long again with my personal stop a close<88.24 My target highlighted. Process your way.

