Coinbase: Surging HigherCoinbase has surged sharply above the $275.90 level, prompting us to consider green wave finished. Now, we see the stock advancing in wave , which still has more upside potential to finalize light green wave a. Afterward, we expect a corrective pullback in wave b, which may dip below $275.90, before green wave c resumes the advance, thus completing orange wave b distinctly above $275.90.
📈 Over 190 precise analyses, clear entry points, and defined Target Zones - that's what we do.
COIN trade ideas

6/23/25 - $coin - If u like $crcl u should like $coin better6/23/25 :: VROCKSTAR :: NASDAQ:COIN
If u like NYSE:CRCL u should like NASDAQ:COIN better
- hard enough to own a lot of things long
- but NASDAQ:COIN basically keeps majority of the economics it generates w/ NYSE:CRCL 's chitstablecoin called USDC
- nevermind it's trading at a similar valuation with fin metrics that are literally MULTIPLES larger (3-5x) than NYSE:CRCL
- anyway.
- buy NYSE:CRCL at your own peril. and perhaps the more obvious pair here than even NYSE:FI would be long NASDAQ:COIN and short NYSE:CRCL (I have put this on FWIW)
- the idea would be to use NYSE:CRCL short profits to either move into cheaper NASDAQ:COIN or $obtc. if NYSE:CRCL continues to run, i'd guess the beta on NASDAQ:COIN is now going to catch a wind as well and IV is a whole lot cheaper (on the long side) and the nominal px's for each r roughly similar $300
- gl to all.
- stay frosty :)
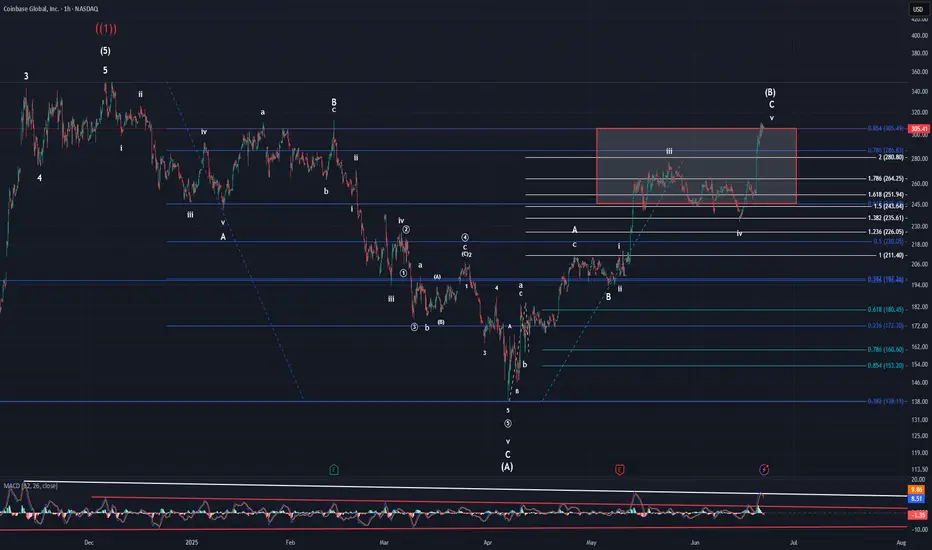
V

CoinbasePrice technically speaking has a full 5 waves with this latest move higher off the $240 low. I don't believe the micro-waves 4 & 5 are done yet though. MACD has reversed and looks to be heading down now, so I think that wave 4 will be kicking off starting Monday. Technically speaking, thus pattern could be complete, but my gut tells me that it is not. It is already overextended as it has breached the 0.854, but I still believe this is intermediate (B) due to the preceding price action.
In short, my primary is we get a slight move lower for 4 and then another slight high for 5 of v of C of (B). The ALT is that we head lower from here kicking off (C).
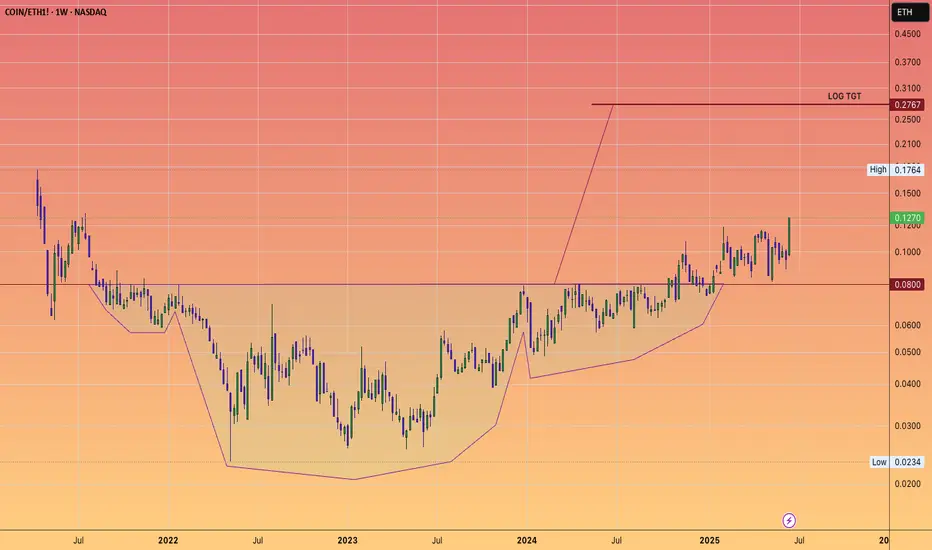
The Chart you don't want to see: Coinbase Vampire attacked ETHBrian Armstrong is a significant influencer in both Silicon Valley and now Washington, D.C., where he is instrumental in shaping legislation and attracting investments that benefit Coinbase and its shareholders.
Vitalik writes blogs and appoints EF directors who appear to have ambiguous gender identities and are quite out there on the spectrum.
Jesse Pollak is yet another astute player who has leveraged ETH's technology to transform BASE into a powerhouse integrating neatly into Coinbase platform for payments and now DEX trading within app.
ETH will thrive.
However, as we've observed, Joe Lubin's return as a public figure to advocate for and steer the future of Ethereum has never been more crucial.
But will it be sufficient to compete with Brian and Jesse? They seem to be operating on a significantly higher plane.
COIN: Weekly Cup & Handle Setup• Long-Term Bullish Trend and Pattern : The price action for COIN exhibits a clear long-term bullish trend, contained within an ascending channel (demarcated by the green and red dashed trendlines). A prominent "Cup and Handle" pattern appears to have developed, with the blue arc delineating the "cup" phase and the subsequent period of consolidation forming the "handle."
• Current Consolidation and Key Levels : Following the completion of the "cup" and a test of its rim, the price has entered a consolidation phase, depicted as a descending channel (white box) which constitutes the "handle." The current price is positioned near the upper boundary of this consolidation, resting above an "Intermediate support" level at $270 and a "Short-term Support" zone between 220- 230.
• Defined Support and Resistance Zones : Multiple significant horizontal support and resistance levels are identified. Stronger, more historical support zones are marked at 145−165 and 115−130. Overhead, a "Key Resistance Level" at $350 coincides with the cup's prior high, representing a major hurdle for further upside.
• Projected Price Pathways : The chart outlines an implied bullish continuation scenario (purple dotted path) where the price breaks out of the handle consolidation. This projected path targets immediate levels around 290−300, followed by a potential retest and breach of the $350 key resistance, with a subsequent "Long-Term Target" set at approximately $430 within the confines of the primary ascending channel.
Disclaimer:
The information provided in this chart is for educational and informational purposes only and should not be considered as investment advice. Trading and investing involve substantial risk and are not suitable for every investor. You should carefully consider your financial situation and consult with a financial advisor before making any investment decisions. The creator of this chart does not guarantee any specific outcome or profit and is not responsible for any losses incurred as a result of using this information. Past performance is not indicative of future results. Use this information at your own risk. This chart has been created for my own improvement in Trading and Investment Analysis. Please do your own analysis before any investments.

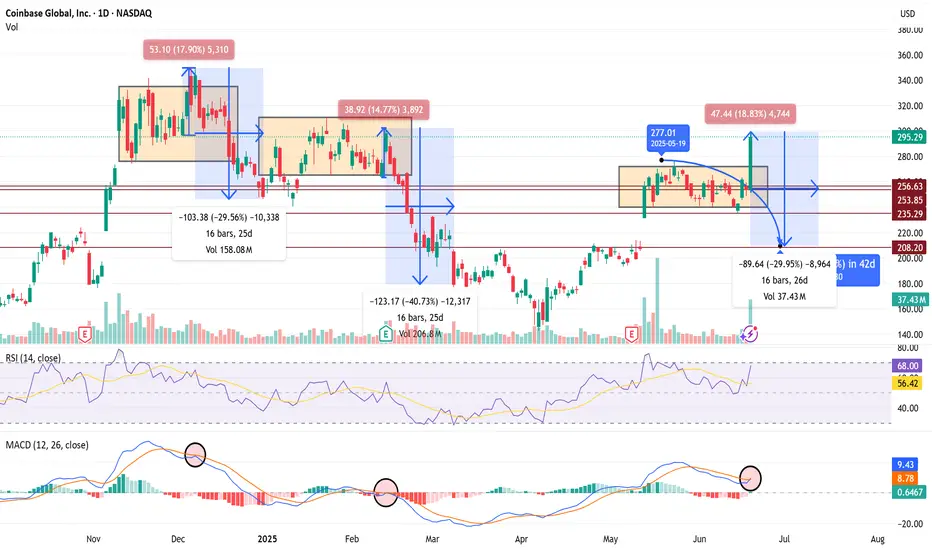
$COIN 30% Pullback Confirms if we Fakeout Recent 15%+ Rally 🧨 COIN SHORT TRADE IDEA — FAKEOUT TRAP IN PLAY
Ticker: NASDAQ:COIN
Date: June 20, 2025
Thesis: Breakout trap setup — expecting a rug pull / red reversal tomorrow to confirm.
🔍 Context
Price broke above range today with a big +18.8% candle to $295 — but...
Volume spike may signal exhaustion, not strength.
RSI = 68 → near overbought
MACD curling into a bearish cross — same signal preceded the last -30% and -40% drawdowns.
History: Same range-break setups in Dec and Feb collapsed hard (-30 to -40%) over 16–25 days.
💣 Trade Plan (Short Setup)
Entry Trigger:
🔻 Enter short if price closes below $277 tomorrow — confirms breakout trap.
Targets:
🎯 Target 1: $253 (top of old range)
🎯 Target 2: $235 (mid-range support)
🎯 Target 3: $208 (full breakdown move, matches last 2 cycles)
Stop Loss:
🛑 Above $297 (breakout highs)
Timeframe:
1–3 weeks (16–26 bars historically)
🧠 Bias
Bearish unless bulls hold $280+. If we get a big red daily candle tomorrow, fakeout confirmed — high-probability follow-through expected.
COINBASE: Is it a guide on how to trade PEPE??Coinbase saw a massive surge yesterday as the Senate cleared the path for stablecoin regulation. This turned its 1D technical outlook almost overbought (RSI = 68.001, MACD = 11.870, ADX = 26.090). Our TP = 348.50 on COIN remains but oddly enough, we see a stronger than expected correlation with PEPE. Since it is now lagging after the Senate decision, this may be a great time to buy PEPE as this pattern shows that soon it will follow Coinbase upwards anf they will converge.
See how our prior idea has worked out:
## If you like our free content follow our profile to get more daily ideas. ##
## Comments and likes are greatly appreciated. ##

Coinbase ATHHello
Regarding the real opportunity for COIN to reach all-time highs — look at the megaphone, it’s happening.
On the technical side: monthly bullish breaker, heavily manipulated. Price flipped the equilibrium and is now expanding toward the first level of algorithmic targets
NFA

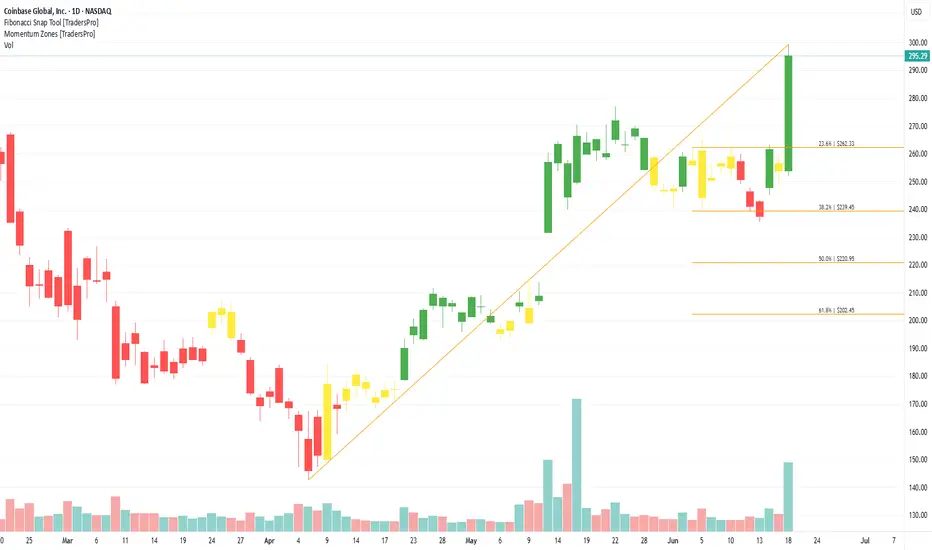
Coinbase Global, Inc. (COIN) Powers Crypto TradingCoinbase Global, Inc. (COIN) is one of the largest cryptocurrency platforms in the U.S., providing a trusted marketplace for buying, selling, and storing digital assets like Bitcoin and Ethereum. Known for its user-friendly interface and strong security, Coinbase supports both retail and institutional traders. The company’s growth is fueled by increasing crypto adoption, rising trading volumes, and its expanding lineup of blockchain-related services.
On the chart, a confirmation bar with rising volume confirms momentum. The price has moved into the momentum zone after breaking above the .236 Fibonacci level. Using the Fibonacci snap tool, traders can place a trailing stop just below the .236 level to manage risk while capturing more upside.
Coinbase Shares Rise Following Stablecoin Legislation ApprovalCoinbase (COIN) Shares Rise Following Stablecoin Legislation Approval
Shares in Coinbase Global (COIN) surged by 11% yesterday, making the company the top performer in the S&P 500 index (US SPX 500 mini on FXOpen).
The sharp rise was driven by news that the US Senate has approved the GENIUS stablecoin bill, which sets out a regulatory framework for the use of stablecoins — crypto assets whose value is pegged to another currency or financial instrument, such as the US dollar.
The bill (which still requires approval from the House of Representatives) would pave the way for banks, fintech companies, and other financial market participants to use stablecoins. This development acted as a strong bullish catalyst for COIN shares.
Technical Analysis of Coinbase (COIN) Share Price Chart
In our previous analysis of the COIN share price chart, we:
→ identified an ascending channel (shown in blue);
→ suggested that the COIN share price could rise towards the psychological level of $300.
That projection has played out — the price is now very close to the $300 mark. So, what comes next?
In a bold, optimistic scenario, buyers may hope for a continuation of the rally, with the share price pushing towards the upper boundary of the long-term ascending channel, especially following the recent news. In the medium term, the blue ascending channel may remain relevant, given the strong signal of improved cryptocurrency regulation in the US legislative framework.
However, we also note some vulnerability to a pullback, as:
→ the $300 level may act as significant resistance;
→ the price is approaching the upper boundary of the blue channel, which also shows resistance characteristics;
→ once the initial wave of positive sentiment fades, some investors may look to take profits, especially given the more than 20% rise in Coinbase (COIN) shares since the beginning of the month.
This article represents the opinion of the Companies operating under the FXOpen brand only. It is not to be construed as an offer, solicitation, or recommendation with respect to products and services provided by the Companies operating under the FXOpen brand, nor is it to be considered financial advice.

ANOTHER COVERED CALL ON COINI bought to close my previous one. That is linked below.
I sold for 2.33. BTC for .80 on Friday. With today's LARGE move AND being a retest gap, I will sell another one. TREND is still bullish. Buy dips and hold on!

covered call on COINCryptos are pumping.. Trend is bullish. Moving averages, gaps, volume, everything looks like this should eventually resolve higher.

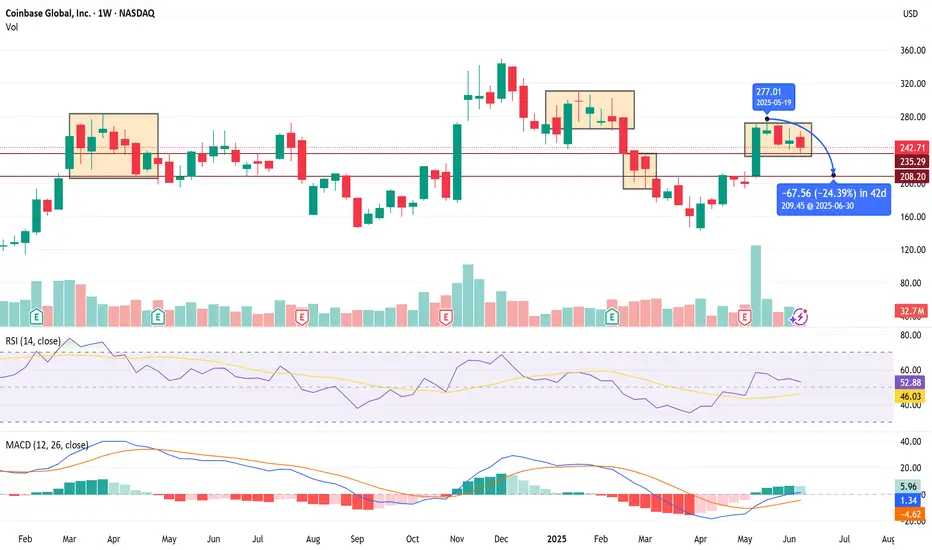
$COIN Daily/Weekly — Setting up for Knife Action Below 235 📉 COIN Daily/Weekly — Setting up for Knife Action Below 235 🔪
Thesis:
Price action continues to mirror prior failed consolidations followed by sharp flushes. After weak consolidation near 277, we are seeing early signs of exhaustion. Current price sitting at 242.71, directly above a key pivot zone at 235. Historical behavior suggests we could see another aggressive leg lower if 235 breaks.
Key Levels:
🔑 235 — critical trigger level for downside.
🔻 208 — primary target (prior support + measured move target).
❌ 250-255 — invalidation zone on strong upside reclaim.
Historical Context:
Previous breakdowns off similar consolidations have produced sharp -24% to -37% drops within 35-42 days.
Current measured move targets a similar ~24% decline in 42 days to 209 area.
Weak consolidation above 235 usually precedes these knife moves.
Trigger Plan:
Watch for early week failed push into 242-245.
Breakdown through 235 triggers short entries.
Momentum into 208 target ideally within 1-2 weeks, though conservatively allowing for 42 days based on historical pattern.
Indicators (Supporting Bearish Bias):
📊 RSI stuck near neutral but rolling over.
📉 MACD losing bullish momentum.
🔻 Volume has historically spiked into breakdowns.
Summary:
Expecting a flush below 235 to 208 if weakness confirms. Quick failed rallies into 242-245 could offer ideal short entries. Any weekly close under 235 will confirm bearish momentum shift.
⚠️ As always, this is not financial advice — strictly my personal trade plan.
- Taz
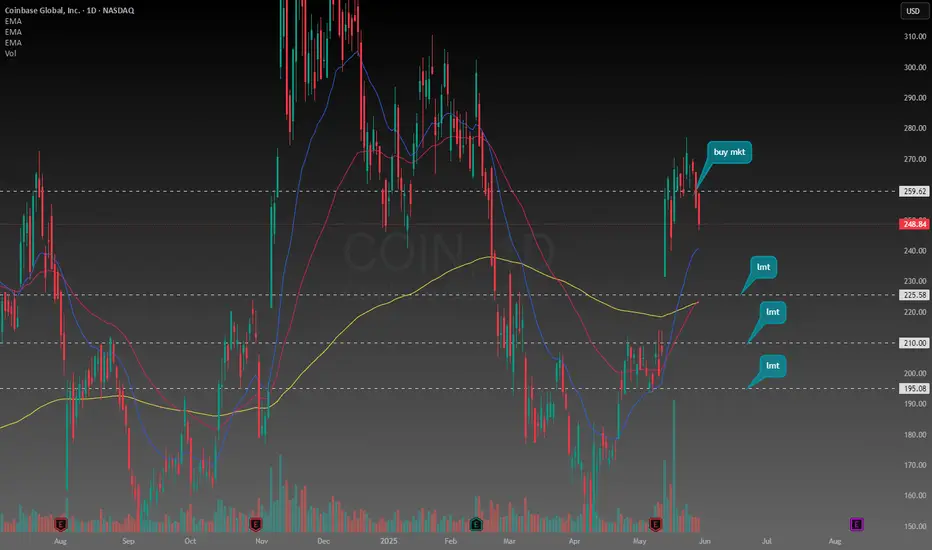
Identifying Buy Zone on $COINBased on the trend analysis, buy zone is around 220-120 range.
There's a good chance NASDAQ:COIN will retest this range, consider it's the most important zone here to decide wether this stock will sideways for a long-time or bounce back to the top.
Although it's unlikely to be reached in the near time, the Bottom Zone is identified and will be a very good value to buy.
Terimakasih.

$COIN i following this gann arc quiet nicely!once price breaks the arc it will gravitate to the next one


Buying opportunity for COINSince the news on May 13, COIN has slumped with the rest of the crypto market. It appears to be consolidating and has shown promise since the large drop last Thursday. With Bitcoin appearing to approach the highs once again after retracing to the 0.3 level, there is a good chance COIN may reach the 350 level or beyond in the near future.

Cup and handle on COIN 500+ targetAs most companies after IPO, we got the drop and now the bouce, forming a cup and handle, if it keeps to break it we should see COIN above the $500+ in coming months. This aligns with Bitcoin expected rally.
Not financial advice, just a hobby.
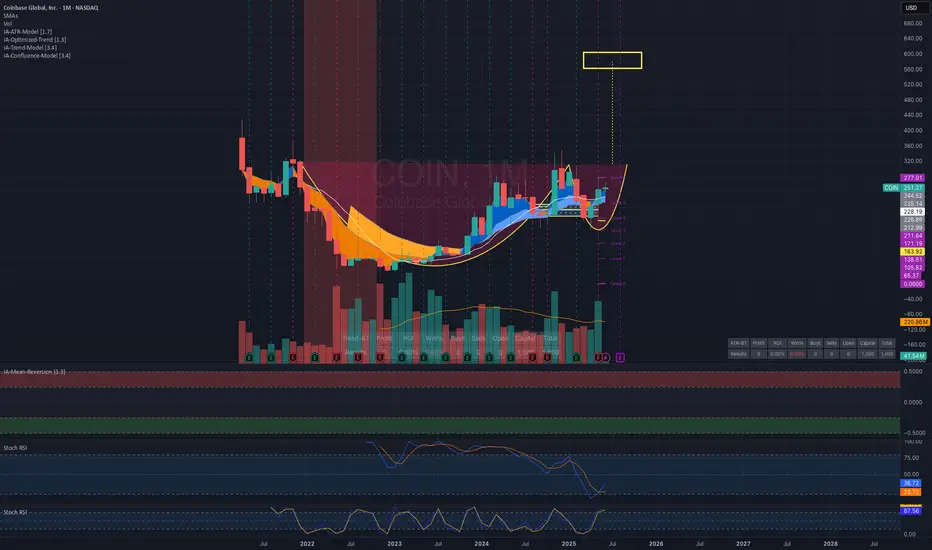
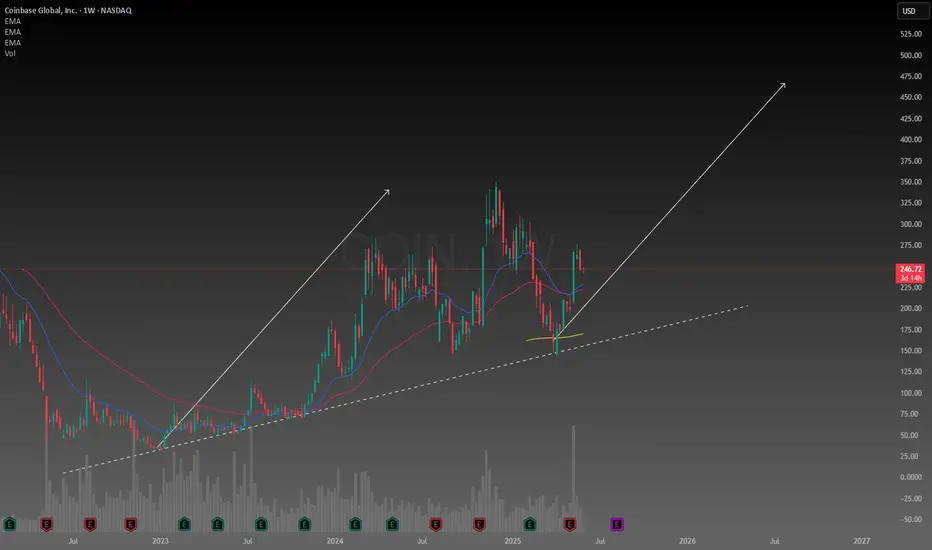
Coinbase $450 price target for next 12 monthsSimple Coinbase trend analysis on the weekly chart looking like a second leg up. The range of the intrinsic value of the stock is between $195 and $450.
COIN Scalp Short into LongCoinbase has benefited from the recent strong uptrend for the bitcoin price , and despite news regarding hacks and security compromises, Coinbase still manages to remain in a strong uptrend.
At present, we have some missing data on the chart where there is an existing gap at approx $230 in confluence with the VWAP (Volume Weighted Average Price) which is a moving average I like to use as confirmations for continuations of a trend.
In this scenario, a potential scalp short, into a long trade would be an interesting setup presenting itself here , given we see strength return to Bitcoin, Coinbase can be a primary beneficiary for a potential rotation back to the ATH zone.

Coinbase is an excellent instrument for exposure to cryptoTrading at roughly 2x the price of Bitcoin, Coinbase presents a unique opportunity for exposure to the crypto sector. Fundamentally it is better to invest money for the long term on a business that generates revenue. I am very bullish on crypto, but with limited funds I want to make sure I deploy my capital as intelligently as possible.
There is several interesting strategies Coinbase uses to generate revenue based on crypto and blockchain processes and capabilities. From being able to exchange currencies like traditional currency systems for payments or money transfers. Mining proof of work assets like Bitcoin have used far too much resources to not be considered "valuable, and scarce". Proof of stake where staking rewards payout better than most dividends. Recent institutional adoption by some of the most significant entities. Coinbase has a portfolio of most of the crypto currencies so it guarantees a diverse exposure to the sector.
Its very obvious the people are loving crypto currencies, I want to be exposed to crypto but also want to invest in the fundamentals of generating revenues. Coinbase is the perfect vehicle in my opinion for exposure to crypto they generate revenues based on commissions and spreads, I'm sure they have some other strategies they use to consistently generate income even if crypto is going down, so that makes me even more convicted in my decision to put my money on Coinbase stock. Only being listed on the Nasdaq for four years I believe we are in for a wild ride to the upside so long as Bitcoin and the crypto market as a whole continue with this volatile momentum.
COINBASE: 3rd Bollinger Squeeze is a pullback buy signalCoinbase is bullish on its 1D technical outlook (RSI = 65.834, MACD = 21.140, ADX = 19.909) as it is extending the bullish wave following the S1 rebound. The Bollindger Bands are now expriencing a squeeze, which is the 3rd since the bottom. The 2024 bullish wave also had three Bollinger Squeezes with the 3rd being the last that made the 349.50 High but not before a pullback to the Bollinger bottom. If that takes place, it will be a signal to go even stronger on the bullish side and target the R1 level (TP = 348.50).
## If you like our free content follow our profile to get more daily ideas. ##
## Comments and likes are greatly appreciated. ##

CoinCoinbase under pressure after surging to $271.
A reported hack and data breach is fueling the sell-off.
Correction targets: $218 and $180.
Watching for further downside — panic could escalate.
