Time to enter ASX:CSL ⁉️Last week, CSL management received positive feedback and the stock is currently in a base. While there is no confirmation of a new trend, the risk-reward ratio is favorable to add a small amount and let the market guide for further additions. I will only add up to 50% of my position in the low base, so if the stock fails to reach its all-time high, I will still have some gains to take away. The stock symbol is $ASX:CSL.
Disclosure: I am investing in my super account for the first trance I cannot provide any recommendations to buy or sell. It is essential for you to conduct your own research.
CSL/N trade ideas

Australias CSL Trading in a range on the monthly.Not one I am personally trading at the moment, but CSL was one of the most reliable stocks on the Australian market for years. Since 2020 though it has been stuck in this sideways range that could be good for the worlds slowest swing trade :)
Being towards the bottom of the range might mean there is some upside on the table if the ASX is a market you trade.

CSL at support?Looks like a good buying opportunity for CSL at previous support.
Broader economic downturn may invalidate this trade.


CSL looking unwellSo... my previous bullish attempt at this pattern failed, and I am now looking at the bearish play. A rising wedge pattern, looking to break from the rising support line. If this plays out, then the target will be around $248. The target is supported by the height of wedge, fair value gap and fib level, so looks to be a very strong possibility. The bearish sentiment is also supported by the disruptions to CSL business (Vifor), a higher cost environment, interest rates rises and latest drop in dividend payout.
DYOR and trade at own risk.

CSL 3WK AnalysisCSL is showing weak strength. Possible reversal from 3WK trendline. Expect price to move to 282. It could also touch strong support at 242 zone

CSL breaking ascending triangleWas watching this for a while. It just popped. Missed entry yesterday, but will wait for a re-test to enter. Entry at $309 for a target of $334. SL @ $307.
DYOR and trade at own risk.

Analysis: two possibilitiesOn this stock we will have a reversal trend if we have the breakout with strenght the vwap indicator and the resistance line by a big green candle with a large green volume. In other hand we could have a downtrend continuity if we have the breakout with strenght the vwap indicator and the support line by a big red candle with a large red volume.Thanks.

CSL Testing highsAbove upward sloping 20, 50 sma
RSI above 50
Macd positive and above signal line
Target conservative previous highs

CSL.ASX_Bullish Breakout Trade_LongENTRY: 299.20
SL: 285.64
TP: 317.82
- ADX<25. Would like to be higher.
- Daily RS +ve
- Daily FFI +ve
- Weekly RS +ve
- Weekly FFI +ve
- Moving averages are aligned.
- Breakout of consolidation area on 6 Jul 2022 before going into another consolidation range.
- Recovered well on 17 Aug 2022 after earnings indicating possible buyers still in play.
- Entry today based on breakout and rebound off 10EMA and 20EMA with volume. Would like the rebound to be >3%.

CSL Australia SSI Live Trading Series
Sun Storm Investment Trading Desk & NexGen Wealth Management Service Present's
Focus: Worldwide
By Sun Storm Investment Research & NexGen Wealth Management Service
A Profit & Solutions Strategy & Research
Trading | Investment | Stocks | ETF | Mutual Funds | Crypto | Bonds | Options | Dividend | Futures |
USA | Canada | UK | Germany | France | Italy | Rest of Europe | Mexico | India
Disclaimer: Sun Storm Investment and NexGen are not registered financial advisors, so please do your own research before trading & investing anything. This is information is for only research purposes not for actual trading & investing decision.
#debadipb #profitsolutions

CSL Australia Sun Storm Investment Trading Desk & NexGen Wealth Management Service Present's: SSITD & NexGen Portfolio of the Week Series
Focus: Worldwide
By Sun Storm Investment Research & NexGen Wealth Management Service
A Profit & Solutions Strategy & Research
Trading | Investment | Stocks | ETF | Mutual Funds | Crypto | Bonds | Options | Dividend | Futures |
USA | Canada | UK | Germany | France | Italy | Rest of Europe | Mexico | India
Disclaimer: Sun Storm Investment and NexGen are not registered financial advisors, so please do your own research before trading & investing anything. This is information is for only research purposes not for actual trading & investing decision.
#debadipb #profitsolutions

CSL for a breakout & grind higher on improving fundamentalsCSL is seeing improved plasma collection as places like the US start to return to normal. Additionally the Vifor acquisition should complete in the next few months with the potential for the stock to re-rate higher. The stock has formed an ascending triangle formation with resistance being tested on multiple occasions at the 273/274 level at which a major stock placement to fund the Vifor acquisition was recently conducted. A breakout at 274 was observed with the stock pulling back to retest that level as support. With improving fundamentals and a bullish chart formation, I think this stock is good for a trade. Targetting 297 to the upside as measured by triangle width and aligning with level from which the stock fell when the recent placement was announced. Placing stops just below the ascending trendline.

At what Price am I looking at CSL again ?CSL charts suggest that the price action is looking for a support zone and if it eventuates the $200 - $230 range would be a great spot to pick it up for a long term hold.

CSL Sideways Move, Break Up or DownCSL seems to have been moving Side ways from the high of $335 on the 17th Feb 2020, Resistance seems to be set around the $315 - $320 Mark with the market trying to push through this level on 4 occasions; 17th August 2020, 30th November 2020, 30th August 2021, and recently 22nd November 2022. From the RSI and MACD indicator below and the the bearish trend of the Overall market, I feel resistance level for CSL will remain the $415-$320 Mark.
I have drawn the current support level at the $270 mark as it has been support on 3 occasions; 27th July 2020, 11th January 2021, and 5th July 2021.
It has been a key level on one occurrence of 19th April, from resistance to support, additionally the recent Capital Raise was set at $273 per share.
I feel the next resistance level which will determine the direction for CSL for the next few months will be set at the $252 Mark, It has been a support level on two major occasions; the first being on the 23rd of March 2020 after the "Flash Crash", the second on the 8th of March 2021. The second date displays a Doji Candle trend reversal after the stock had been falling form the 30th November 2020 after failing to break the resistance level as mentioned above.
With the overwhelming amount of negative news lately I feel as if the $270 support level will be broken as the RSI and MACD indicator shows the Sellers are now in control. The next support level I've identified around the $252 mark, I feel it may bounce off this support level given the Strong fundamentals and CSL share holders being optimistic regarding the acquisition of Vifor Pharmar . The Moving average of 21 also shows the commencement of a down turn for CSL which from past data usually last 3-4 months.
I would keep ASX:CSL on a watch list to see how the price fluctuation unfolds and see what the charts are telling Us prior to Jumping back in, Would appreciate your feed back and your thoughts on CSL Australia.
Warm Regards

Boomer Stock Down...Premium Blue Chip Boomer stock appears to be in the bull trap stage, this is all relative to my view of another global crash.

Can CSL Limited (ASX:CSL) reclaim its December magic? Past 4 December returns have been inconsistent & provide a good example of ever-changing cycles. Only 1 December loss from 2000 to 2016. Then only 1 positive December from 2017 to 2020.
Data is for informational purposes only & is not investment advice. Past performance is no guarantee of future results & may not be repeated.

CSL @ 12 OCT 2021Text me if you have any questions/comments for me.
-----
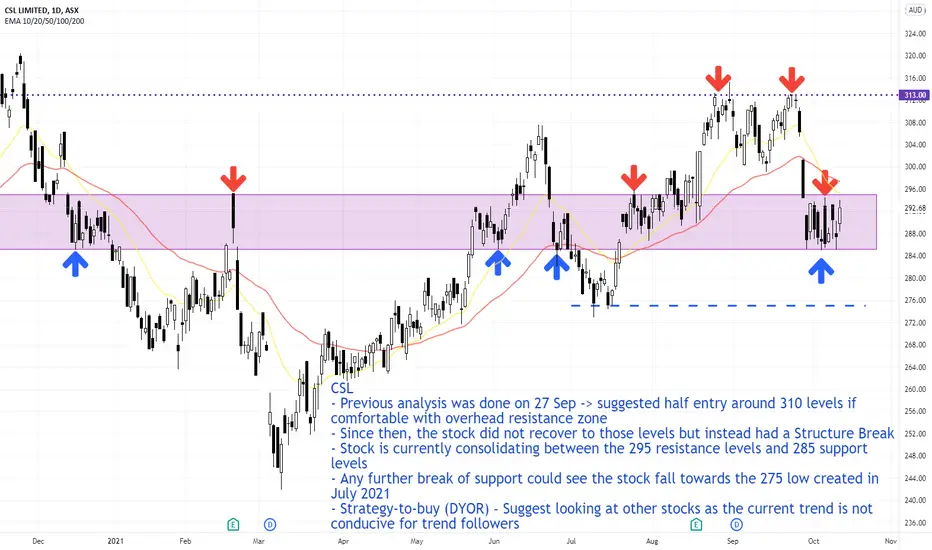
CSL
- Previous analysis was done on 27 Sep -> suggested half entry around 310 levels if comfortable with overhead resistance zone
- Since then, the stock did not recover to those levels but instead had a Structure Break
- Stock is currently consolidating between the 295 resistance levels and 285 support levels
- Any further break of support could see the stock fall towards the 275 low created in July 2021
- Strategy-to-buy (DYOR) – Suggest looking at other stocks as the current trend is not conducive for trend followers
CSL - Are the Bulls Entering at Support@As we can see that the Support Zone of $268.00 - $274.00 has been strong because it got bounced off in the end of July 2020, and price made a high of $320.00 then. Now that CSL was plunging, the same support has held very well and we can see the downtrend line violated, with a Bullish Candle closing above it, with High Volume.
MACD has also crossed and RSI has come out of the Oversold region, indicating that the Bullls have taken control and want to take it higher. My targets are as follows:
1. TP1 is $287.00 - $290.00 region (Resistance 1) (4% - 5% potential)
2. TP2 is $298.00 - $300.00 region (Resistance 2) (8% - 9% potential)
Please note these are my own notes, by no means trading advice. Please do your own research before entering into any trade.

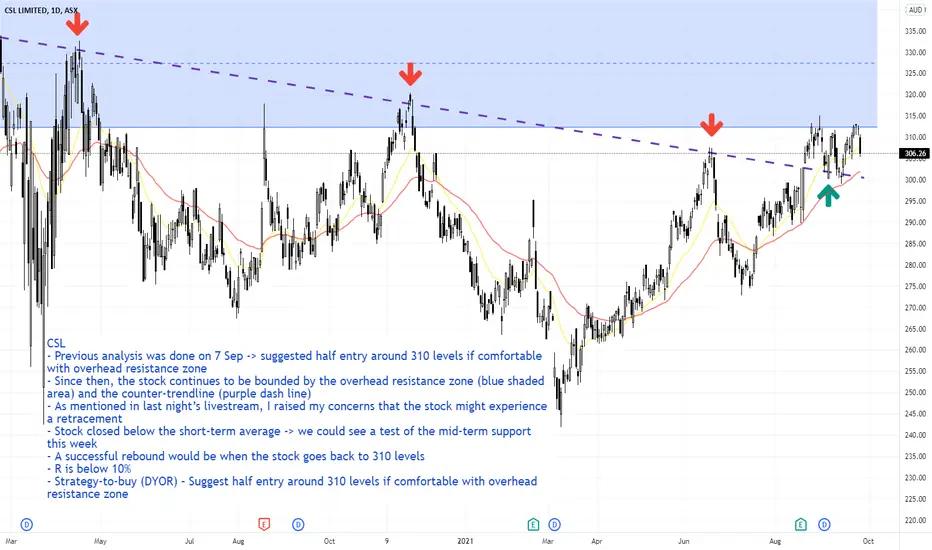
CSL @ 27 SEP 2021Text me if you have any questions/comments for me.
-----
CSL
- Previous analysis was done on 7 Sep -> suggested half entry around 310 levels if comfortable with overhead resistance zone
- Since then, the stock continues to be bounded by the overhead resistance zone (blue shaded area) and the counter-trendline (purple dash line)
- As mentioned in last night’s livestream, I raised my concerns that the stock might experience a retracement
- Stock closed below the short-term average -> we could see a test of the mid-term support this week
- A successful rebound would be when the stock goes back to 310 levels
- R is below 10%
- Strategy-to-buy (DYOR) – Suggest half entry around 310 levels if comfortable with overhead resistance zone

CSL goes to next level at 356Based on the chart, we can see a breakout, retest point at around 307 with a huge volume.
CSL is sideway, if it break the resistance at 320, it'll go to the previous ATH then 356 based on Elliott Impulse Wave.
I think investors will taking profit, because appearing a doji candle on the top in 31 Aug and 23 Sep. Caution that!!!
Share with me about your thought.

$CSL All aboard!! 297.5 or so ALL ABOARD!!!!BReakout from massive wedge/bullflag/thing being backtested.
Even more bullish than I'd expected! Wow. Let's see if she pushes off again.
