CVS: (Long) FIB Resistance Speed [Layered] Origin Price(s): 60.14 (3/27/18); 63.04 (6/28/18); 72.82 (09/05/18) Destination Price(s): 79.97 (09/20/18); and, 90.00 (Analyst PT 9/17/18) For Educational Purposes Onlyby wjd432
Rising rendIt is not seen at the first view but the fork is showing it already: With the current breakout we started a new uptrend.Longby motleifaulUpdated 4
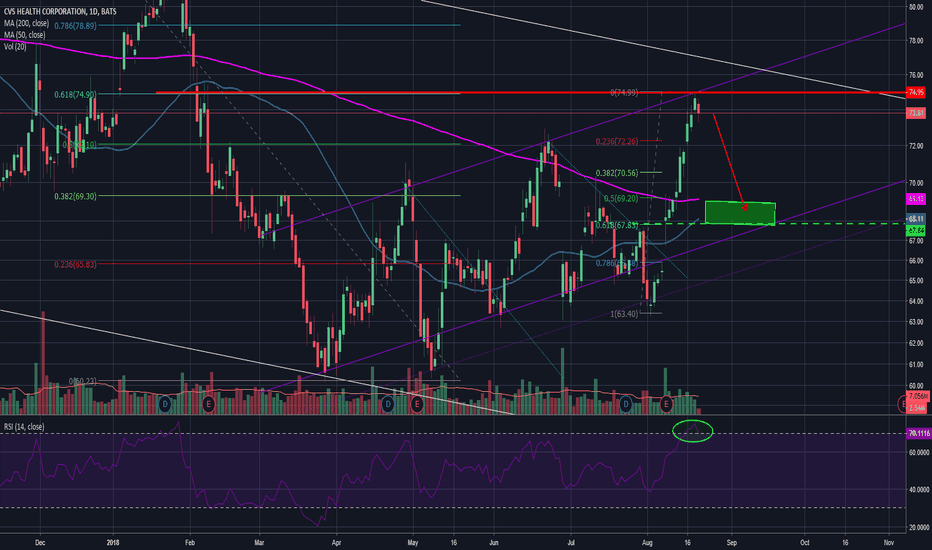
CVS short term pull backShort term pull back to test 200 dma and original gap up area.Shortby Yogigolf1
CVS- Wave 5 target at 75.49. Picture perfect Leading diagonalwith perfect touches for waves 1~4, MACD just starting bullish climb, 200 ma turning upslope and clear skies.Longby Will_Wong887
CVS putsFor CVS I see a pattern on daily view Inside bar At Upper BB then the fall A Good entry might around 71.30 tomorrow or above assuming everything is OK. As they like to delay the pattern recently Aug24/31 68 puts will be Good. As for You to be Quick ITM 71 puts Will be Good tooby pigla_al2
CVS Long IdeaShould have posted this sooner, but have been shot down several times this year when getting constructive on this name -CVS may finally be ready to break out -The stocks been stuck for most of 2018; falling backwards each time it's attempted a run, usually due to some headline (Amazon getting in the space for example) -Strong earnings and fundamental story; cyclically resilient business - Still trading at less than half its historical PE Longby ML6101
CVS Bounced Nicely Off Support, Potential To Rise Further! CVS bounced off its support at 63.28 (76.4% Fibonacci retracement, 100% Fibonacci extension x2, multiple swing low support) where it could potentially rise up to its resistance at 67.58 (61.8% Fibonacci extension, 61.8% Fibonacci retracement, horizontal swing high resistance). Stochastic (89, 5, 3) bounced off its support at 3.6% where a corresponding rise could occur. Longby FXTM_ForexTime1
Looks like an uptrend CVSHigh lows and higher highs, most encouraging trend since the 2015 peak.Longby YogigolfUpdated 332
CVS Long Argument.Information regarding my bullish view is provided in the text on the chart.Longby QuileHills2
Long!On this bullish "W" bottom breakout and retest of the breakout level with positive trading!Longby SigmaPicks1
CVS long following bottoming out, monthly bullish divergenceCVS has formed a descending triangle and daily appears to be closing above the upper triangle (break out). We have a monthly bull div on the RSI. A forming daily wedge will provide good stop for our trade. R:R lies in longing at break out confirmation.Longby autemoxUpdated 1
A PRZ - CVSWe may have a PRZ at the 60 level. Price has bounced off of the 60 area (long term 61.8 fib) 5 times over recent weeks and appears to be seeking support here. Target 105 SL below 55 Cheers!Longby hondazzz1
$CVS Long-term Chart Bearish$CVS showing a bearish gravestone doji on the daily to remain trapped in what looks like a descending triangle pattern forming. Ideally would like to see another red candle tomorrow for confirmation. Targeting 5-10% downside in the near term. If $60 support fails, could see 15-20% downside before next ER.Shortby Triple_Barrel_Capital1
This lovely drug store should bounce sooncvs is a dime piece, it has had a rocky road since mid 2015, but this will soon turn around ! Longby adolphus531
Possible double bottom on CVSSeeing a possible double bottom on the daily CVS chart. Possible bounce back upwards? Just an idea not financial advice. Longby bisighini120
CVS offers high risk/reward entryFA wise, CVS is not a terrible stock. The company has been making consistently increasing both in revenues and earnings the last few years. My stock valuation system gives it good scores both in valuation and quality domains. TA wise, the low of $60 at end of March confluently hit the big support trend line and 61.8% fib level and bounced off strongly in 5 waves from there. All of that offers a very promising entry point around $64 level. Latest earnings call which is considered as negative offers us a nice pull back from the last 5-wave bounce taking price right to ~$64 level. Conservative target: $80 (green box). This is also an important POC level in weekly chart. Reasonable target: $90 (blue box). This is a reasonable level for the next considerable retracement. Stop loss: below 60. { "info": { "close ": 64.47, "marketcap ($bil)": 67.1, "name": "cvs health corporation", "sector": "health care", "industry": "medical/nursing services", "country": "united states" }, "val": { "peg_k": 0.40787581, "fp2e_k": 10.12087912, "p2e_k": 10.01086957, "p2e": 9.99534884, "p2bv": 1.7412767, "p2sales": 0.35731722, "p2fcf": null, "ev2ebitda": null, "ev2ebitda_k": null }, "val2_k": 30, "val2_q": 19, "qual2_k": 55, "qual2_q": 38, "qual3_k": 55 }Longby SharpChartsUpdated 0
CVS Relief Rally on the wayShort sellers are exhausted after nearly 5 years of selling. CVS looks to be forming a W bottom at the 60 level, earnings have been steady and increasing for sometime making CVS a great value at this price, expect a 20-40% increase when shorts get squeezed in the coming weeks. My conservative target is in the 83, actual target is 95. Stop is a little under 60. Longby Tanner1
Shorting CVSI think there is more drop ahead. My target range highlighted. Process your way. Shortby goodguy442
#CVS i am long CVS ...price of CVS could double by year endRevenue and Income Net Revenues 2014 2015 2016 2017 139.4B 153.3B 177.5B 184.8B CVS is making money ....business is BOOMING every year , they making more money every year .....this dip is a buying opportunityLongby juliothetrader0
CVS Looking Like a BuyBull wedge, good valuation, skirting the lower bollinger bands both near-term and long-term. Longby isosphereUpdated 2