Endava plc to begin new bull market?On the above 2-week chart price action has corrected 85%. Popular finance articles and now even legal action is proposed, everyone is a bear.
“Investors who lost money on Endava plc(DAVA) should contact The Gross Law Firm about pending Class Action - DAVA”
PR Newswire, Oct 7th
Seriously? Price go down and your response is legal action?!
That’s bitter.
Should we be joining the bearish sentiment? Or cease an opportunity from angry sellers?
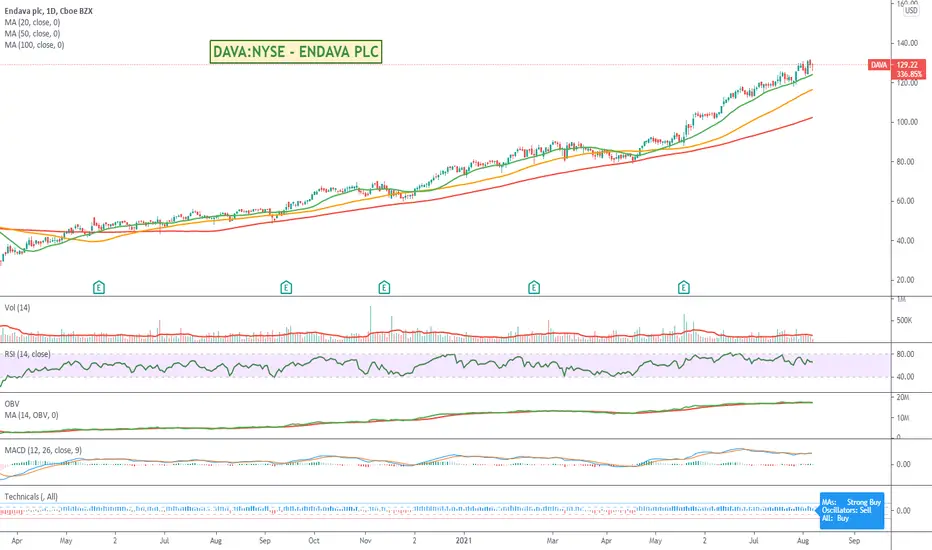
** The Technical analysis **
1) Price action and RSI resistance breakouts.
2) Price action is on legacy support from January 2019!
3) No stock splits.
4) Regular bullish divergence, lots of it.
Is it possible price action continues to correct? Sure.
Is it probable? No
Ww
Type: Investment
Risk: You decide
Timeframe for long entry: Before the judge throws out the lawsuit and tells investors price action go down as well as up.
Return: Will say so elsewhere
DAVA/N trade ideas

DAVA Reversal Pattern Ideas with Bullish Divergence!Hey Folks,
I've been noticing some buzz about this one, as well as solid price forecasts. Here is what I think of the chart and what I plan to do.
It has some nice upside potential if it can remain bullish.
Happy Trading!
OnePath

DAVA- Falling Wedge BreakoutEyeing DAVA here after closing last week reclaiming its respective 50-day EMA. DAVA's been holding a massive falling wedge on both the daily and weekly timeframe. This is accompanied with its Bollinger bands squeezing on the weekly timeframe and a Bullish Cypher Harmonic Pattern as it heads into earnings. Additionally, on the daily timeframe DAVA is holding the same falling wedge, an ABCD harmonic pattern has formed, a MACD Golden Cross, and is sitting right on its 50-day EMA with the 100-day and 200-day starting to curl upwards. Bullish and will be looking for a breakout from this wedge (broader market conditions & earnings permitting)- Just some FIB levels along with some RSI-based supply and demand zones to keep an eye on in the meantime.
--See Below for Weekly Timeframe & Price Targets--
PT1- $79.54
PT2- $81.03
PT3- $86.76
PT4- $90.71+
--Weekly Timeframe--
- Falling Wedge
- Bollinger Bands Squeezing
- Bullish Cypher Harmonic Pattern

DAVA Double TopNot the greatest setup, but it does present a double top pattern. There's a chance this get reflected off the EMA 200 or SMA 200 and potentially retest the neckline or wick through the neckline to take out some shorts hiding above who got in on the breaking candle.
Entry - Test of neckline $139-140
Stop - $150
Target - $113 - $114
Risk to Reward - 2:1

$DAVA Setting Up a Move to ATHs$DAVA on watch for the next couple days to see how it reacts to its ATHs supply line.
Not in a rush to buy it. would like to see a bit more days below that line.

DAVA , LONGTaking a shot at DAVA with an entry at 137.27 and a stop vs 132.79. It was between this or ROP or perhaps some of both but I liked the way this one opened more as well as its volumes look a bit healthier to me . Suggest a limit order and not market for it to get a better fill , noticed slippage was potentially high with a market order .
Was tempting to put stop a bit lower and give this some extra room but that also put my 2R scale area above current high . Decided to go with the tighter option of the two which puts 2R below the high and helps me to potentially reduce risk a bit sooner if trade works .

$DAVA a strong stock I'm watchingWe have very small volume bear day (day where there are significantly more selling pressure) according to my indicator: Pressure Chart or Pressure Candle.
A close above the most recent bear day is an add. The stock has strength being a tech stock in the UK. If it keeps holding the 9 VWEMA then $DAVA is very bullish.

Super Steady Runner Up 300%Endava provides technology services for clients in the consumer products, healthcare, logistics, and retail verticals in Europe, Latin America, and North America.
It has had a nice steady run a bit over 300% since its last dip, and up over 140% for the last year.
Never know when the trend will end, but it's had a pretty good run so far.
$DAVA can rise in the next daysContextual immersion trading strategy idea.
Endava plc provides technology services for clients in the consumer products, healthcare, logistics, and retail verticals in Europe, Latin America, and North America.
The demand for shares of the company looks higher than the supply.
This and other conditions can cause a rise in the share price in the next days.
So I opened a long position from $101.52;
stop-loss — $95.51.
Information about take-profits will be later.
Do not view this idea as a recommendation for trading or investing. It is published only to introduce my own vision.
Always do your own analysis before making deals. When you use any materials, do not rely on blind trust.
You should remember that isolated deals do not give systematic profit, so trade/invest using a developed strategy.
If you like my content, you can subscribe to the news and receive my fresh ideas.
Thanks for being with me!


Long here from 43.90 $SPY $DAVA Relative Strengh at NH Relative strengh at new high, strong earnings +32% and sales +20%, second stage base.
