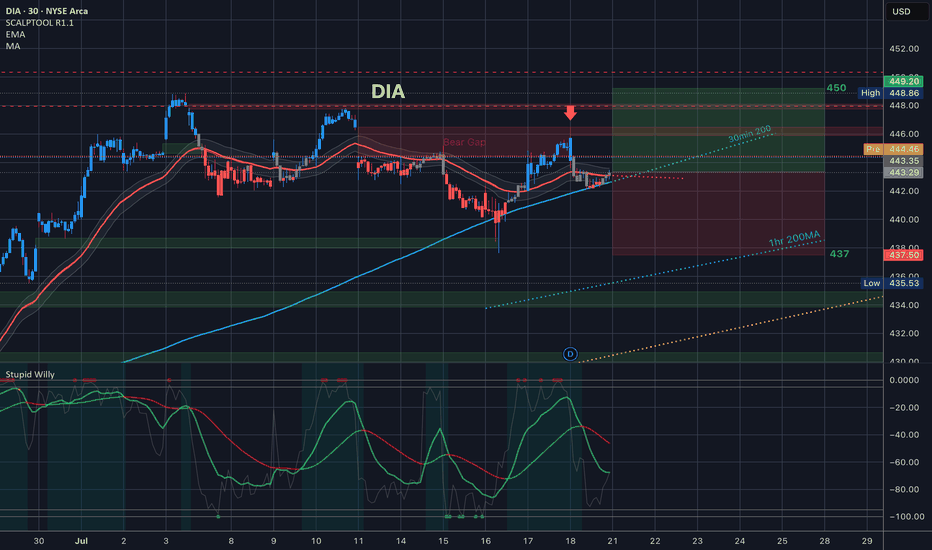
DIA trade ideas
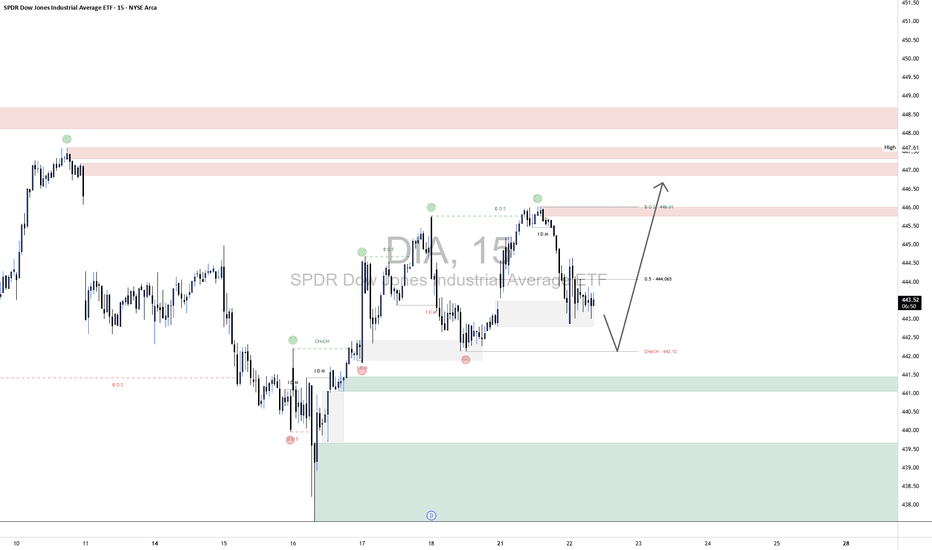
DIA "Dow Jones Ind Ave. ETF"DIA 15-Minute Technical Outlook
The DIA chart reflects a short-term corrective structure within a broader bullish sequence. Recent price action has established new break-of-structure (BOS) highs, followed by a pullback toward a key internal liquidity zone. Your zones (supply and demand borders) are strategically placed and suggest an imminent inflection point.
🔍 Market Structure Overview:
A Bullish Break of Structure (BOS) occurred at 446.91, confirming bullish control in the short term.
Price has since retraced from this high, forming a local lower high near the 0.5 fib level of the last impulse, indicating a healthy pullback phase.
The recent Change of Character (ChoCH) at 442.12 aligns with a potential short-term retracement target and serves as a key validation level.
🟩 Demand Zone Analysis
Level: ~440.60–442.00
This green zone is supported by multiple confluences:
A prior liquidity sweep and bullish impulse, signaling strong buyer interest.
Proximity to the ChoCH, adding structural significance.
A demand imbalance that remains unmitigated, making it a likely reaction zone.
📌 Expectations: A retracement into this zone may provide a low-risk long opportunity targeting a retest of the 446.00–447.50 supply cluster.
🟥 Supply Zone Analysis
Level 1: ~446.00–446.91 (short-term supply near BOS)
Level 2: ~447.60–449.00 (higher-timeframe unmitigated supply)
These zones represent areas of historical selling pressure and potential liquidity traps where price may encounter resistance. The stacking of zones increases the potential for a reaction or short-term rejection.
📌 Expectations: Should price approach these levels post-demand bounce, tight management or scaling out is advised.
📈 Technical Confluence Points:
Fib Retracement (0.5): Price is hovering near the 0.5 level of the recent bullish leg (~444.05), acting as interim support.
US Downgrade, 3-5-10% Pullbacks But Still Bullish on S&PHappy Sunday!!!
US Futures open lower after Friday's close and Moody's downgrade.
Last time this occurred in 2011, the S&P dropped around 10% from the "news."
This is all interesting timing but I'm still liking pullbacks for opportunities to position
bullish in the US indexes (S&P, Nasdaq, Dow)
Because the melt-up continues to run (US/China gap last week and drift higher), I'm trying to stay patient for a pause or pullback
Trump and Bessent are still chirping about Tariffs and a government "detox" so a round of trade war related news may help calm the market's red hot advance post April 7 lows
I'm selling calls on owned positions for income. I'm waiting for more favorable levels to add new positions, but within 3-4% of all time highs for the S&P and Nasdaq I don't think anybody will be surprised to see the all-time highs revisited in the near to medium-term
Let's have a great week - thanks for watching!!!
-Chris Pulver
$DIA - Recap of Last Week April 14-17
Last week we had a shortened Trading week because of Good Friday.
We opened DIA with a gap up and over the trump tweet gap and we were met with resistance right at the downward facing 30min 200MA
You can see the three arrows all week — you don’t want to go long at a downward facing moving average.
Wednesday UHC and Jerome powell both took a toll on the Dow, and Friday we gapped down and traded near the bottom of the implied move.
I look to the Dow as a leading indicator of market health. When we started in slide down off of ATH’s we saw it in the DOW first. Dow had a rough week here last week. Red 35EMA rejected at the 30min 200MA
Technically a beautiful week. All while closing within the implied move.
ALSO - take a look at where we saw the signal line turn red.
$DIA Boom From the Bottom to the Top of the Implied Move
The entire Trading Range is sitting on top of the 200 Week Moving Average.
Alright - Yesterday - We stayed completely with in the implied move - you can see that both sides got tested which gave us some wild swings. Spreads on both ends paid. 10% intraday moves
We hit the bottom of the implied move, the top of the implied move and we saw resistance at the 35EMA.
$DIA Historic Drawdown Week in Review A historic drawdown week with unprecedented tariffs not seen since right before the great depression.
We broke many supports and are looking for Support
Stay Tuned - Today's Trading Range is coming out.
Don't rush into a trader just to trade - But also, if you see a great opportunity take it.


