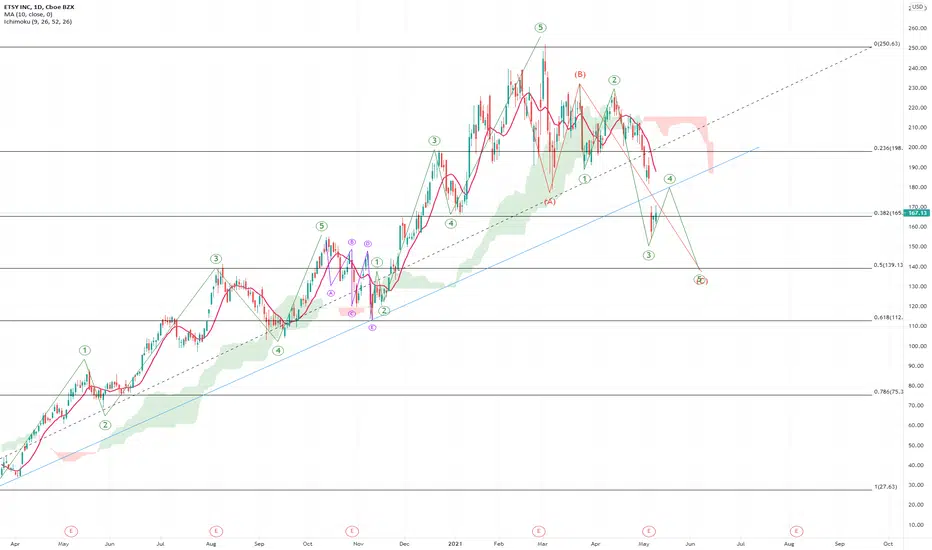
ETSY High probability trade 1 month time frame.You can trade it, or even hold on for a year, but this looks like a cheap entry price with powerful support lines, good potential upside.
ETSY trade ideas

ETSY BUY OR LONG, TARGET $250ETSY has broken out of a bearish wedge and is bullish, the initial target is the old
$250 top area, however there is still a stop loss to protect around 6%.


Found main chanelJust something to keep in mind. Respect the trend. Even when there's breakouts and dropouts.

ETSY @ ema50 on W1, a potential break higher.We can stalk the stock on smaller tf's for a confirmation.


ETSY Correction Time to BuyEtsy has an fantastic business model of Anti Amazon and Millenials and GenZ are flocking to it. If you look at their last IR Preso it seems they are dominating in Craft, Reused Fashion, and Reused Furniture market. Resales Market will heat up as Inflationary signals take place. Current pressure Amazon and only Amazon. Currently stock did a correction to 160's and its time to buy a few to get in the game. If stock crosses 180's its bound to be at 209 in Jul 21.

ETSY reversal in motion?ETSY Daily TF
------------------
Analysis
Etsy holding a strong support trendline with a gap to fill at 181.61. Convertible offering yesterday caused the stock to drop nearly 4% after hours. However, $ETSY was quickly bought up today and closed strong above yesterdays (6/8/2020) close. Getting close to crossing the 20d ema and looking primed to retest that downtrend resistance line. Ideally would like to see a strong push over 175 and hold for continuation. Long Term outlook is looking stronger with recent acquisition of Depop.
Targets: 181, 190+
Key Levels
Support: 162, 153.86
Resistance: 172.58, 175.50, 181
Trade Ideas
1. Shares
2. 1-2+ week out calls (atm/ otm)


Etsy $etsytook a trade today 162 to 164. i will buy again at 162 if it touches it.
2.25/1 risk reward. buy zone. stop and target posted

Diamond TopThere are several ways to estimate targets for this pattern. The white lines show two ways, and there is no way to know for sure when buyers will come back in.
A diamond top is more often than not, a bearish, trend reversal, chart pattern.
A diamond top is formed by two symmetrical triangles, so forming a diamond. It is often a lopsided diamond.
A diamond top has to be preceded by a bullish trend. This pattern marks the exhaustion of the buying current and investor indecision.
Volatility and oscillations increase in the first half of the pattern (i.e. in the symmetric broadening wedge pattern); then decrease in the second half of the pattern (i.e. in the symmetric triangle).
A diamond top’s price objective is calculated by plotting the minimum height of the diamond at the exit point. Some would treat it as an ugly top and find the neckline.
Sometimes the exit movement is as fast as the upward movement that preceded it.
No recommendation.
I am not sure what earnings were exactly, but I am not sure ETSY ever had a chance right now in the current market conditions. )o:
Price is below the lower bollinger band with the moving average set on 80 verses 20.

ETSY must retake the 200As title, ETSY has fallen down badly and now rests below its 200 day sma which it must take to stop a further fall.
Out of this stock for the time being but would rebuy once it shows ability to hold 200 day sma as the last time it was under it, it stayed there for a bit of time.

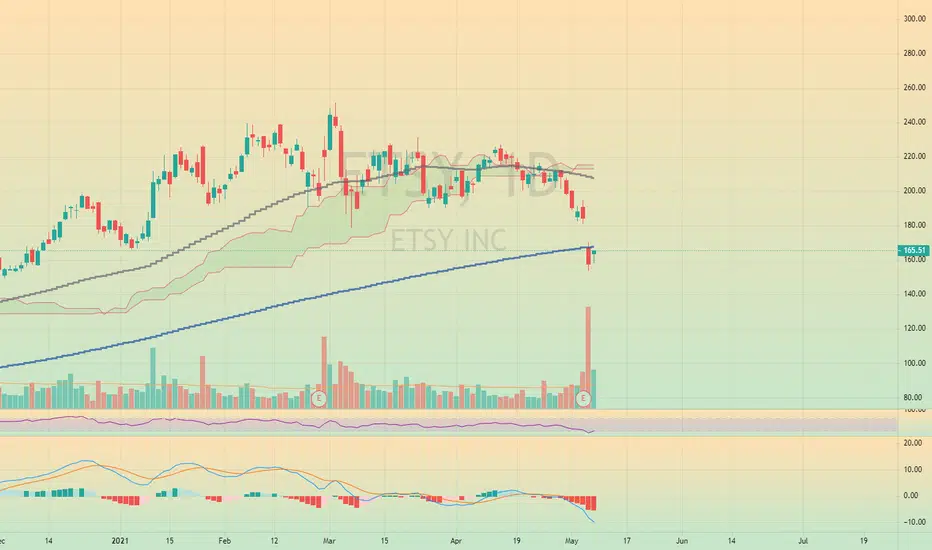
ETSY (DAILY TIME FRAME) GENERAL ANALYSISDespite ETSY reporting earnings that surpassed analysts expectations ETSY shares still slid as management expects the total sale of goods on its platform to slow in the second quarter as it faces tough comparisons to last year’s pandemic-boosted results.
Based on the current price action I'm operating under the assumption that ETSY is in a downtrend. The gap down is a red flag of the weakness on the buy side of ETSY. I would stay away from any immediate rallies up until the price exceeds $192 or closes above the mean. After the price gap down this does look like an opportunity to buy but I would caution against blindly buying the dip as ETSY can shed a lot of dollars should it break its support of $153.50
(Conduct your own due diligence, or consult a licensed financial advisor or broker before making any and all investment decisions. Any investments, trades, speculations, or decisions made on the basis of any information found on this site, expressed or implied herein, are committed at your own risk, financial or otherwise.)

ETSY, TIME TO BUY?Hello fellow traders and investors, here's another trade idea.
ETSY has recently pulled back to the trendline and it offers a 40% ROI if it recovers to the take profit area.
Technicals:
The Macd indicates that it's oversold and still in a downtrend.
The RSI is very oversold
The has been exhaustion in the selling volume and we have started to see some buying volume which is a sign of a reversal
When To Buy:
Now
When To Sell:
I recommend selling at the take profit area
Fundamentals: Etsy, Inc. engages in the operation of an online marketplace. It offers handmade products such as shoes, clothing, bags, and accessories. They have a P/E of 48, a P/S of 9.88, a debt/equity of 1.98, a growth in sales Q/Q of 141.40%, an EPS growth Q/Q of 882.10%, a profit margin of 23.50%, and a short float of 5%
Rating: 85/100 the technicals look great however their valuation is quite rich and they do have a lot of debt compared to their equity however with their amazing growth and margins it definitely deserves a 85/100.
I hope you enjoyed this quick analysis and many more to come.
If you enjoyed leave a like, follow, comment your thoughts and share this trade idea.
Thanks.

ETSY long4 hour being to look decent. Still no confirmation, but i'll take the risk if going long rn.


Big gap down on ETSY earnings.Etsy took a big hit post earnings which I suspect might be a bigger reaction than warranted. One to keep an eye on over the next few days to see if the rubber band effect closes it back up.
