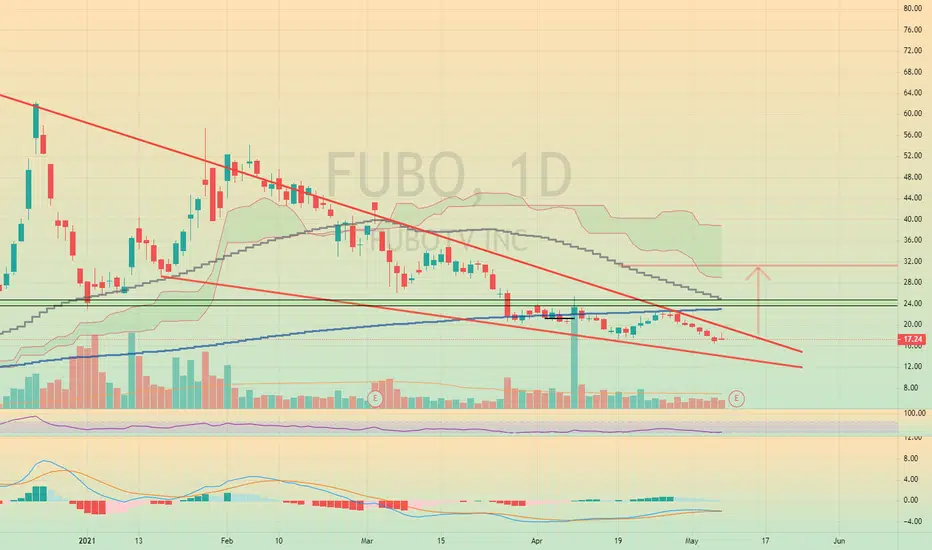
$FUBO FuboTv Inc Resistance / Target Levels
Hopefully you find the chart helpful in terms of Supports & Resistance etc.
we refrain from adding commentary on the chart as that is reserved for our members and we are very conscious of not giving financial or trading advice.
Thank you for taking time to consult our chart and we would really appreciate a like, follow or comment.
FUBO trade ideas

$FUBO Potential Parabolic movement!!!!FUBO oversold in multiple timeframes and hit bottom support. Potential Targets from the 382 @$30 to the 618 @$40. If we golden cross on the daily on multiple timeframes we are potentially making new highs.

FUBO TV a super enthusiastic signal... will be realized ?My marketMiracle advisor returned a purchase signal on $FUBO FUBOTV at a price of 21.43 USD with a target of 134.21 USD or a potential profit of 526 %.. To be honest, I think it is a bit too much, but we are well aware of the volatility characteristics of low-cap securities.
Now, wanting to see the situation on the graph I do not feel like tracing a possible path towards the target that the advisor has given, I think a goal very far and difficult to achieve.
But I have identified a possible path that can lead to the doubling of the title.
I speak of doubling because looking for information on the fundamentals of FUBO TV I saw that in recent results the number of subscribers to their TV streaming service has doubled, so a doubling of the value of the title is certainly reasonable.
This idea is based on a signal generated by the advisor Marketmiracle, down on this page you will find the link to the page of signals of the advisor that you can see for free without any cost or registration

PLAcing BUy trade on FUBo TV expiring JUne 11th Price is showing signs of bullish momemntunm and is breaking out of the box to the upside, long on the stock


$FUBO Descending channel and Broadening right angled formationAfter reaching all time highs as a result of "short squeeze" during late 2020 $FUBO crashed to $23 forming a support line. The price of the stock increased to $58 per stock with good news on acquiring streaming rights of European Football games. People started dumping their stocks (including me) making a huge profit and got out of game.
I would say overall Fubo is bearish and is trading between 2 red lines (descending channel) making lower highs and lower lows. During march the price fell below $23, breaking the previous support line and making new lows. What caught my attention is that the stock broke out of the descending channel by forming a broadening right angled pattern. The stock made 2 minor highs and 2 minor lows which confirms the formation of the pattern. Our previous support line turned into horizontal top resistance line and down slopping trend line once again confirms the broadening right angled formation. The stock made partial rise towards the top trend line but failed to touch it during last few days. I expect short term bearish continuation. I would expect 10-15% decline in price in upcoming 2 weeks.
I would suggest to wait for the final confirmation of volume as in these types of formations prices can break out in either direction.
This stock is on my watchlist and I made a good profit In January. I will give you an update next week if I see any signs of a breakout.
Good luck and trade smart! (not a financial advice)
Please like and share if you like my idea.

FUBO Fubotv breakdown two plausible pathsEven with missing expectations everything else on this stock has been extremely good and the price is very under valued. Expecting a boom in this soon.
by iCant84it
05.17.2021

FUBOFubotv Inc (NYSE:FUBO) The daily chart is looking good for this stock and we could be looking at the start of a sustained price recovery. The price may start forming the second ascending impulse to break the descending channel. I think we could see more gains from this stock over the next few trading sessions.


possible reversal on FUBO bumpy road thoughLooks like FUBO might have gotten out of the downtrend it was. Still a bumpy road ahead into a new run up. Looks to me that the 35 area might be a tough area of resistance to break once it gets there. Still, leap calls on this would be a great option.

FUBO has a lot of fuel after positie Q1 earnings reportFubo broke above trend line and still has 20% till next resistance. Furthermore, it can move even higher. FUBO has a lot of fuel after positie Q1 earnings report.


Watching FuboTesting a fib line watching with alerts PT on 6.18 potentially higher lots of chatter on this one


FUBO Daily with Fib Retracement and Volume ProfileNo position but it seems to have found a solid bottom.


$FUBO FUBOTV Bullish Divergence
It has been a panful decline and may not be over but there has been some rest bit in recent days.
The stock is trying to form a bottom having today closed above the POC.
Volume is steadily gaining bullish dominance.
Bullish divergence on the indicators has aided.
2 key alerts set for Tuesday
- A break above the 21EMA
- A break above the 200ma
If this can be achieved on good volume there is room to run to $24.60 & $26.00 before major resistances.

$FUBO Trade Idea (Technical Analysis and Breakdown)(Video breakdown) $FUBO has earnings on 5/11 and as its dropped to these low levels I am expecting shorts to start covering and we could see a potential bounce up to resistance in the 28.00-27.50 range.

