GE - consolidatingGE taking a little breather and likely looking to test bottom of channel support. May break and look for breakout support but sitting at 50 day so watching closely. Adding to positions between $10.75 and $11.30. Staying the course and being patient.
GE trade ideas

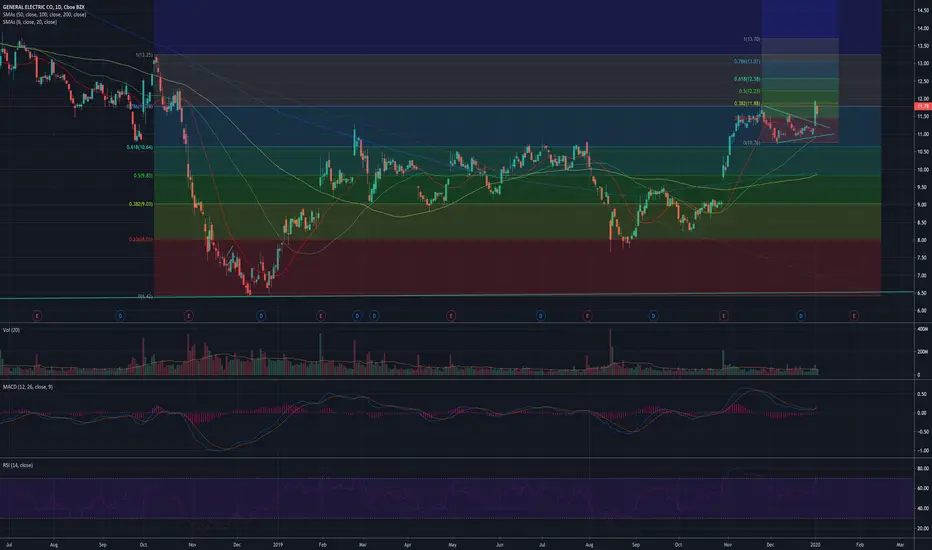
GE (General Electric), Look at this Mirror Level!..In this chart, you can see a nice example of how Mirror Levels works.
If you see such a situation you can open your position with a nice risk/reward ratio!
Push like if you think this is a useful idea!
Before to trade my ideas make your own analysis.
Write your comments and questions here!
Thanks for your support!

GE - revisited!GE moving along as expected. Consolidating impulse leg that took out two prior peaks. Looking for next move to $13.63. I expect this stock to be a winner this year. Larry Culp doing his thing and turnaround is a process. Is it sexy? No. But if you're looking for conservative plays within this crazy momentum market this chart looks very traceable to the upside. Moving averages all look nice. RSI and MACD may move sideways a little longer but I do not expect this stock to give up much. Nice FIB support here on both the impulse leg and the breakdown area from Oct 2018. Be patient here.

GE 1 month Boom or bust?We have two scenarios on the table for GE here. If it holds support at the 89% fibonacci level then we can expect a potential move much higher shown with green boxes as targets. I derived these targets using fibonacci extensions. the elliot wave subwaves are in yellow.
If it breaks below the 89% fibonacci level we can expect a potentially devastating scenario with it going to zero.lets stay optimistic and go long with the stop just below the 89% fibonacci level as it seems the more likely outcome.
Good luck and happy trading

General Electric Trade setup Entry level $12.50 = Target price $15.50 = Stop loss $12.00
Levels of Interest = $12.32 daily resistance
Bullish outlook for the stock as sentiment and technicals look more and more positive. Hated in 2018-19 its finding some love.
Average Recommendation: oVERWEIGHT Average Target Price:$12.13
10 BUY
00 OVERWEIGHT
09 HOLD
02 SELL
Company profile
General Electric Co. is a technology and financial services company that develops and manufactures products for the generation, transmission, distribution, control and utilization of electricity. Its products and services include aircraft engines, power generation, water processing, security technology, medical imaging, business and consumer financing, media content and industrial products. The company operates through the following segments: Power, Oil & Gas, Aviation, Healthcare, Transportation, Appliances & Lighting and GE Capital.
PLEASE GIVE US A LIKE IF YOU FIND OUR CONTENT HELPFUL, IT IS REALLY APPRECIATED

GE SHORT FROM 12.5 his bullish move will end around the $12.5 and we'll have shorting opportunity wait for price action and div for confirmation

Long GE in Sept of 2028 - If you're still alive!NYSE:GE
Go ahead, my flame suit is on! :)
Rising Market - Triangle Correction Pattern
Trade:
Long in 2019
Sell in Mar 2026
Long in Sep 2028 - Ride this pony until retirement or gift onto your family.
NOTE: Not investing or trading advice, entertainment only!


Ge is a clear reversalBeen playing since 11 now at 11.99 about to break 12
Already trigger reversal at 11.60 11.80
Double support
Rsi bouncing and ma

$GE11.8 fresh demand good level to add calls for scalp (risky) - More conservative entry near 11.55 level, as there's confluence with triangle breakout level.

GE: Huge signal in both weekly and monthly timeframes...Relative strength in $GE is through the roof here, and very interestingly it comes while insiders are buying shares, after the CEO was fired and the stock removed from the S&P500 index. These are STRONG bullish signals, and not to be ignored.
The fact the stock broke into new 52 week highs, on big volume, while the market was down sharply is a clue here.
I'll be buying into a half position at market open and looking to add on retrace if viable later on.
Cheers,
Ivan Labrie.

$GE ascending triangle breakoutGE bakkt test and run off of the ascending triangle. target area is the golden retrace zone between the .382-.618

GE - revisitedI wrote about GE here a few weeks ago as a name I like for 2020. Yesterday it had a monster move up after consolidating the impulse leg that took out two prior peaks. It was stopped dead in its tracks yesterday after a stretch to the peak that started the downtrend late October last year. I see new money entering and staying with this name. Always have to beware the Stephen Tusa research report but any hits from his reports should be looked at as buying opportunities. I don't expect this to give up much. Looking for $13.25-$13.70 which marks the two FIB tops outlined in the chart.
GE 07.12.19 LongAsset and Time frame -GE,4H
Entry Price -11.10
Exit(Stop Loss) -10.74
Exit(Take Profit) -11.96
The range between stop loss and entry - 0.86$
Technical Analysis -Daily chart is bullish, weekly chart just retested the 100 Daily SMA after making 2 Engulfing bullish candles,4H chart made a pullback and now made an ABCD pattern on the -61.8 Fibonacci level with a good reversal candles& volume.
What can be improved -
Conclusion & End of Trade -

ge w,m viewsOn the left we are starting with the weekly just hanging inside just made a mini support on the chart let's see if that can breakthrough @ $10.75 or bounce up and try to give GE life unfortunately we are not know where this is going. Over on the right we're looking at the monthly just inside the triangle let's see if 2020 is a turnaround or another death wave


General Electric (GE) Long PlayGot some GE monthly calls a few days ago on the bounce off support line. Chart lined up with news of GE being a "stock to buy" in 2020. Got in at the support spot rather than waiting for momentum. Broke the 11.20 spot at the eod yesterday. We'll see how it holds up.

Worth keeping an eye on GE for potential breakoutGE gapped up on the last earnings release. The stock managed to get past some resistance levels as well.
The price action is forming a nice tightening range recently (as many stocks have over Christmas).
It may be worth keeping an eye out for a breakout.
Simple formation.

GE at key W resistance | Opp. for shortGeneral Electric has reached a key daily and weekly resistance.
It has already re-tested this resistance and I would like to use it as an opportunity. Now, if the price will have really weakness it should drop and filled a market gap at $9.70 which would be also our target.
If there will be no strength in our resistance I will immediately cut this trade, because overall this stock looks very strong in the short term. Take this idea as some relief to take more longs at $9-10 levels.

Potential Bullish Count...Bullish count plotted with high prob zones...critical support must hold to keep bullish count intact.

GE - DAILY CHART Hi, today we are going to talk about General Electric and its current landscape.
General Electric is poised to receive increasing attention from the market as relevant events are taking place. Despite the good of year of the companies, some mixed events can shift the balance of sentiments; on the concerning side, GE might make a significant blow from the Boeing decision of halt the production of the 737 MAX jetliner, which engines GE is responsible for producing. The optimistic case is built around the hope that General Electric CEO Larry Culp could revert this seatback as he managed to increase the company credibility and the dividend report that is nearing.
Thank you for reading and leave your comments if you like.
To have access to our exclusive contents, join the Traders Heaven today! Link Below.
Disclaimer: All content of Golden Dragon has only educational and informational purposes, and never should be used or take it as financial advice.


