GE This Name Will Become One Of The Best Value Plays In Years Title says it all BUT NOT YET THERE - PATIENCE - A Potential 1000% Hit with some patience to wait for the correct entry #stocks #trading #fintech
GE trade ideas


TSLA vs GE : Weekly agressive scenarios at low risksHope this idea will inspire some of you !
Don't forget to hit the like/follow button if you feel like this post deserves it ;)
That's the best way to support me and help pushing this content to other users.
Kindly,
Phil

GE No Floor in SightTrade Timeframe - 12/10 - Jan 04
12/7 - POTENTIAL OPTIONS PLAY
GE 01/04 $6.00 PUT dip buy $0.06 ($0.15)
IV 71.58% Volume 99 Open Interest 202
Why?
Regarding the dip buy - There is opportunity to get this option at a discount due to mid-day movement and slight optimism as we saw nov 28 - dec 3, but then the option fell back into profit PUT levels. Idea is to "set it and forget it" for the dip buy. $6.45 is the next realistic floor. News also is negative in general.
MACD - Already crested north in the last several days, and is now on the verge to move south
EFI - Momentum has shifted dramatically, and its movement is turning south, showing pessimism
RSI - Although this is an oversold stock, there is nothing in the near future to hold up the RSI
EMA - There is nothing that shows a reversal, and resulting Volume is consistently in "Sell" mode
*Let's see what happens!*
*DISCLAIMER* - I am not a professional trader or stock broker. These are merely my thoughts typed out. If you need professional help with your trades, look elsewhere, not here. Good luck and happy trading.

GE - MACD vs DPOHere DPO shows where money is made much more simply than MACD for General Electric.
Let's say not showing an entry point using DPO on 1 day chart.


LONG IDEIA , LOW RISK ASSOCIATED I RECOMMEND TO BUY , YOU HAVE LOW RISK ASSOCIATED WITH HIGH RETURNS.

GE rebound?GE is right on a BIG supporting trendline, reversal in the move?
Lets see..
Happy trading

GE HIT LOWS, NOW IS THE TIME TO GO LONGI really think that the bashing of GE is now over, the last time this stock was at these lows was in 2008 which was a blood bath, and 1984, as much as cash flow issues as they have had, the new CEO has a lot of work a head of himself. Here is the reality, and Investment in GE Is an investment in America, and say what you want about the tariffs, the trade war, the FEDS raising their rates, we are strong. GE will move back, only a short time.

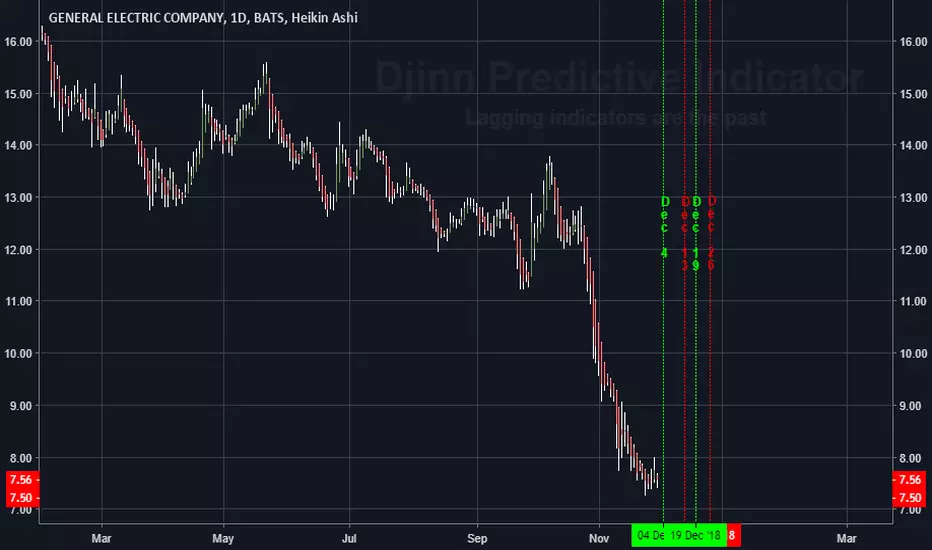
The FUTURE High / Low price swing dates for GEThese are the FUTURE dates for GE (General Electric) with the highest probability for experiencing a
price swing high or low. Apply your own indicator(s) to determine the price swing direction.
The Djinn Predictive Indicator is for sale. Monthly, weekly, daily, 4 hour, 1 hour and 15 min predictive equations included in the sale.
Price: 10,000,000 XRP. Bitcoin or Fait not accepted for payment. I will reluctantly accept Monero.
If the payment is made in Monero the price is double the 10,000,000 XRP asking price.
Matthew R. Kratter's "Rubber Band Stocks" 2nd EditionI describe this strategy in my Kindle book "Rubber Band Stocks"

Is GE Open Interest tipping the hat?Noticed that Dec 21, $10 calls have an open interest of over 90k!
Last time I saw that much option at one price point was at the end of October for $10.50 puts, and look how that turned out.
Someone out there feels pretty confident, and at $0.02 it is cheap enough for me to follow the crowd again.

GE Monthly BounceGood potential for a squeeze not a day trade looking to hold for a while. "GE said the plans, which follow its ongoing strategic review, will mark a shift in focus towards its power, aviation and renewable-energy businesses and create "a simpler, stronger, leading high-tech Industrial company". This is going to occur in the next 12 to 18 months (news came out this june). Revenues in healthcare/aviation have been strong for GE.

GE Short Squeeze Historical LowsThis one is fairly self explanatory, regardless of the massive debt crunch that GE is facing, its important to note how these historical lows and historical resistance levels play into the price action and volatility. The people who buy when others are most fearful are the real winners in financials. Can you imagine buying ford at the end of 2008? Would have been scary in the moment, but would have also allowed massive gains

Let the dogs fightBuyers have not had much of a leg to stand on. Some buyers tried to catch a bounce upon retesting DTL from the upside however were quickly taken out. I expect there to be another wave of buyers at HR1 likely stronger than the last which could pull us back to the DTL. After that I believe there is a high probability of forming an overall P5 but prices may trickle down below our previous P4. I will be sitting out and watching, allot of pain happening in this market.

$GE Monthly bounce back up soonMonthly bounce expected to at least $10,00
My next $GE - Next target is $10,50
40% upside potential.
NYSE:GE

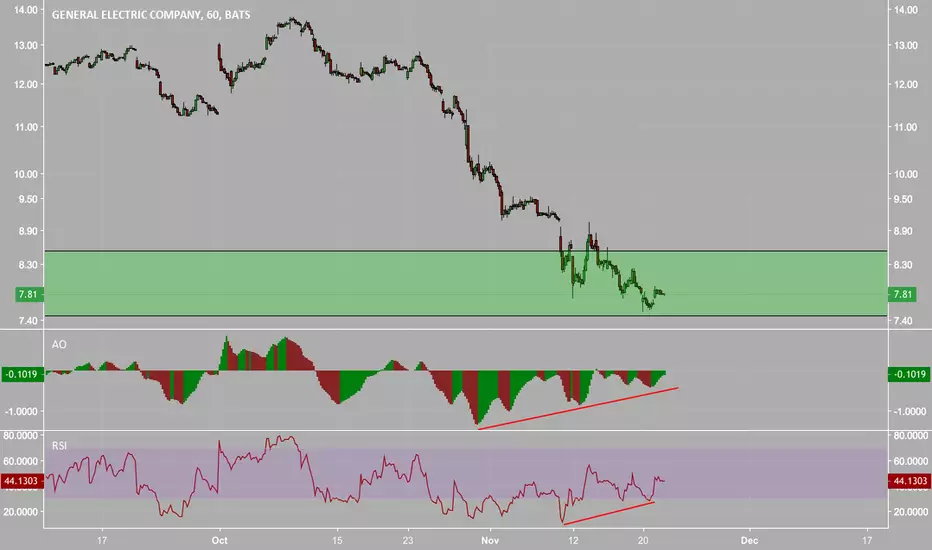
$GE Medium Term OutlookGE looks finally at the bottom (Approaching lows from March 2009)
Selling volume on a steady decline
Bottoming of MACD looks like it's in and attempting to crossover
RSI on a slow and steady incline from oversold territory
I would start laddering in buys as GE is a slow horse with the potential to see very slightly more down, but the bottoming signals are definitely there

$GE Low Timeframe Knife Catchhigh risk trade right here, but this could be the start of painting a bullish divergence reversal on the daily. lets see where it takes us or if bull can push through this


GE - Pressure remains on to the downside!Updated chart shows GE is still in downtrend. Reiterating target of $8.
On March 21, 2018 I posted:
As the saying goes “the bigger the drop, the bigger the need for repair.” Ex - all items, GE’s cash flow has not grown since 1994.
Just back 3 - 4 years ago GE -1.24% was producing ~ $24 billion in cash flow. Using Basel III 2.27% agreement TCE ratios, GE -1.24% is underfunded
by ~ $53 billion as of 3rd qtr. 2017. Assets need to be sold and equity add to the books!
Valuation: Using ex-item numbers, GE -1.24% produced ~$ 8.5 billion in cash flow for 2017. Applying a generous 2% growth rate the
Intrinsic Value Buy price is $6.50 and a Sell at $16.
Target of $8.

GE shares show a lack of demandGE shares have trended down all year with a lack of demand. The stock price reflects the troubling fundamental picture. Shares will stay under pressure until this theme reverses.

Look at this Monthly. $GERsi is in the teens on the monthly.
Divs if we bounce here
Macd looks like sh!t
But my oh my is this bottoming out. i doubt the ones calling $6.00, anything around that 8.00 flat is pay dirt.
