GGAL/N trade ideas

GGAL 7 RRRTrading Methodology:
1. An asymmetric bullish/bearish pennant is drawn using ascending and descending curved trend lines with a minimum of three price action touche points per line. The direction is determined by the previous trend.
2. The angle tool is applied from the earliest two trend touch points, beginning at the earliest touch point.
3. A trend-based Fibonacci retracement triangle is drawn starting from the earliest trend touch point and ending at the earliest touch point of the opposite trend line .
4. Based on the degree, of the earlier defined angle, the appropriate (and secret) levels are selected for the fibonacci retracement ; two levels for stop-loss and two levels for take-profit. The closest stop-loss level to the current price level is the top priority stop-loss. Though the secondary stop-loss level is often chosen for some markets such as FX and some equities in order to account for seldom unexpected resistance breaks. The greater target level is the top priority, and where majority of the shares are sold, though some may choose to close part of the position at the first target level or set it to be the stop-loss once price exceeds it. Entries should be laddered in around the levels closest of the yellow line.
This trading strategy can be applied to any market and time frame, and positions most often garner the greatest risk-to-reward ratio with the highest success rate. What more can you ask for? I will only be posting my unique trading strategy until EOY. I work solely with price action to identify pennants and apply unique trend-based fibonacci retracement levels for SL and TP levels. Reach out to me if you have any questions.


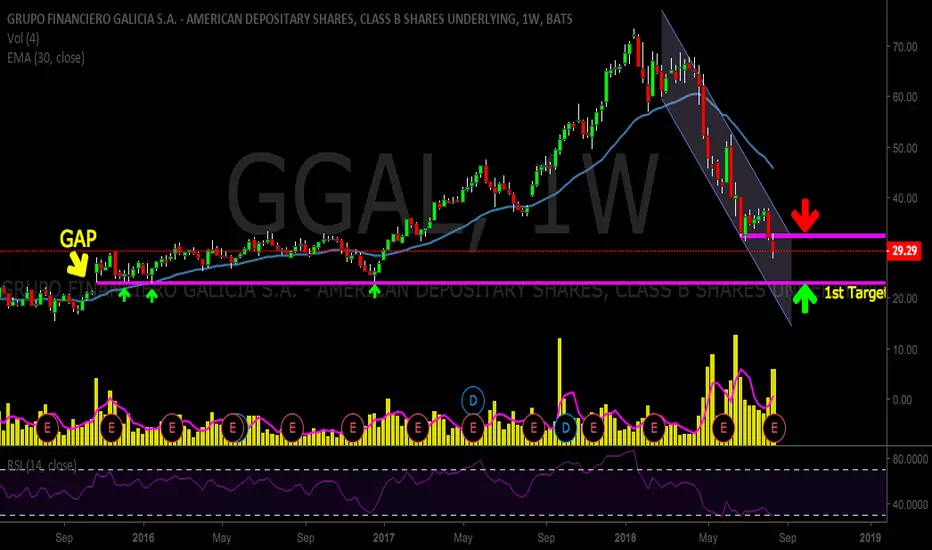
short GGALI expect GGAL to fall to 1st tgt: circa 11 and 2nd tgt (wcs) 6.2 +/-, before October 2019 taking into account Argentina macroeconomic as well as FX situation and volatility in EM.

GGAL Time to go LONGNASDAQ:GGAL
GGAL touched a six month suport line.
Its time to go long.
Short time target: 31 USD


prepare for a little long to 40+double support in 32
+searching the third leg of a strong bullish divergencie objective 40.5 usd
stop: loosing at weekly close the support

bullish divergencie to 34.3+bullish divergencie in RSI 30 min
+over ema9 and ema20
+objective 34.3
control stop under emas or if ema 9 dont broke up ema 20


hammer or nothinglast chance... the abism is near, ...but the bullish divergencies are there, and the dinamic floor too

strong bullish divergencies in RSITry a bullish trade using the bullish divergencies in RSI when ema 4 cut up ema 9 and reforce it when occur the break up of the bearish channel

accumulated bullish divergencies in RSI 30mina nice formation with some accumulated bullish divergencies in RSI and with a recover objetive of 52 usd (aprox 30% up)


GGALNASDAQ:GGAL
GGAL
Banco Galicia perdió desde lo que va del año 2018 un 40% de Market Cap como consecuencia de las condiciones desfavorables macro que enfrenta Argentina (único mercado en donde está presente). Este no es una análisis fundamental sobre su valuación (enviaré por separado) solo refleja una oportunidad de trading que se adecua Risk / Reward Ratio de 4 y cumple con las condiciones de costo de oportunidad de "Bond Parking". En tal sentido se puede observar lo siguiente:
1) Cumple el desarrollo de Elliot casi por completo terminando en el ciclo bajista de la onda B como consecuencia de un Sell off.
2) hasta el momento desde el sell off no encuentra soporte, pudiendo ser el primero en 35 / 35.50 (precio de onda 2 del ciclo alcista). Este precio marca una perdida del 50% de capitalización y empieza a ser atractivos en términos de valuación en el mediano plazo, se podría intuir que en estos valores el ingreso de fondos podrían marcar un piso.
3) Recomendación: Buy 35/35.5 Stop Loss 30.50/31 Take profit 56. El take profit tiene su fundamento en valores fibonacci.
4) Si bien la entrada está en 35/35.50 hay que esperar señales de indicadores matemáticos que convaliden este precio. La volatilidad registrada en el mercado argentino puede hacer que este piso sea perforado muy rápido con lo que quedaría automáticamente cancelado esta oportunidad de trade.
5) voy a enviar las señales correspondientes.
A disposición!
Luis Leiva
luisleiva10@gmail.com
Contesto tarde, I answer late be patient

banco galicia argentina (ADR)que podemos esperar para entrar:
- siempre el RSC pasando a positivo (rojo a verde)
- Sector banks en positivo DJUSBK (se esta dando ahora)
- candel de confirmación
- MM30 mirando hacia arriba


friday of doji gravestone in GGAL-doji gravestone in weekly view
-RSI with a bear divergence in over bought terrain

