Last Chance to Sell $ABXS E L L - Get out now if you can before the new year.
Cause this stock is totally bearish, just look at the chart, all it says is , um meh.
GOLD/N trade ideas

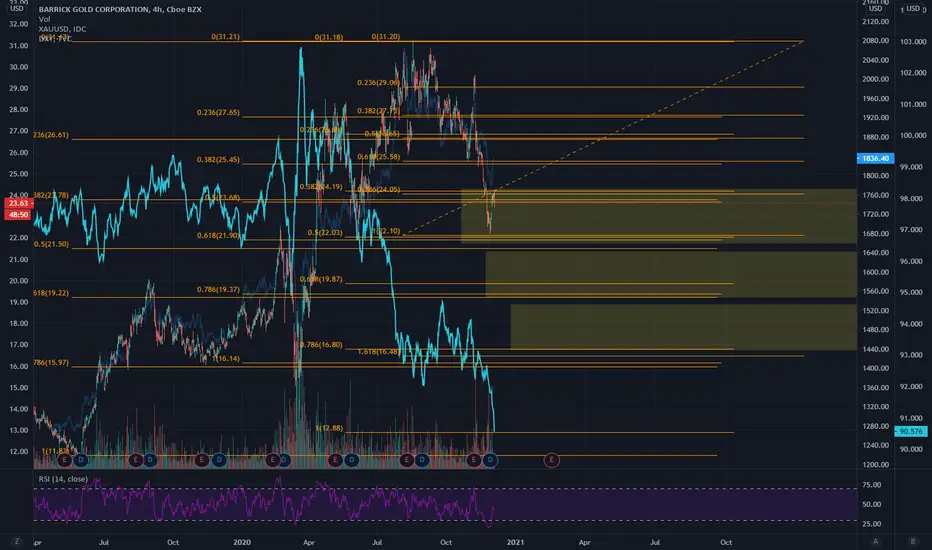
Barrick Gold_WeeklyIf the 30 level on the weekly RSI hold it will mark a higher high meaning a continuation of the trend which started in Aug 2018. In case there's a sharp selloff similar to the one in March, there could be a chance to see even lower levels. Currently watching $18 to $20, ideally $15.50.


BARRICK GOLD LONG TERM LOOK - RISING CHANNEL Expected move to the monthly demand zone and channel support. Long term bounce and continuation of channel to follow.


Barrick Gold potential targetsBarrick Gold potential targets on the chart. Comment below and let me know your thoughts. Feel free to share your work. Thanks!


Barrick GOLD & GOLD/USD 1 year comparisonBarrick Gold (GOLD) reported 3rd Quarter September 2020 earnings of $.41 per share on revenue of $3.5 billion. P/E: 13.8, Div/Yield: 1.32, Market cap: $42B. Barrick Gold engages in the production and sale of gold and copper, as well as related activities such as exploration and mine development. It operates through the following segments: Barrick Nevada, Veladero, Pueblo Viejo, Lagunas Norte, Turquoise Ridge, Acacia, and Pascua-Lama. In December GOLD is building strength and it just so happened to bounce off GOLD/USD as a "support" on the comparison chart. As GOLD/USD value gains going into 2021, so will GOLD. I think GOLD is oversold and it shows that on the 1 year trend channel & rsi. I entered GOLD$23.5straddle at market close on Friday 12/4 because price action insurance is inexpensive. GOLD has an excellent Delta:Theta ratio = 25:1. Do your own due diligence, your risk is 100% your responsibility. You win some or you learn some. Consider being charitable with some of your profit to help humankind. Small incremental steps work : If you double a penny for a month it = $5,368,709. Good luck and happy trading friends...
*3x lucky 7s of trading*
7pt Trading compass:
Price action, entry/exit
Volume average/direction
Trend, patterns, momentum
Newsworthy current events
Revenue
Earnings
Balance sheet
7 Common mistakes:
+5% portfolio trades, risk management
Beware of analysts motives
Emotions & Opinions
FOMO : bad timing
Lack of planning & discipline
Forgetting restraint
Obdurate repetitive errors
7 Important tools:
Trading View app!, Brokerage UI
Accurate indicators & settings
Wide screen monitor/s
Trading log (pencil & graph paper)
Big organized desk
Reading books, playing chess
Sorted watch-list
Checkout my indicators:
Fibonacci VIP - volume
Fibonacci MA7 - price
pi RSI - trend momentum
www.tradingview.com


Barrick GoldShowing Barrick Gold in the Candles. Would like to see it show a bottom pattern before taking a long position.
Also shown in the white line graph is gold price. Gold and Barrick Price should Correlate.
Lastly is a line graph of DXY which seems to be tumbling. Typically gold is inversely correlated to dxy.
These times are intersing so lets see how it plays out.
Good luck.

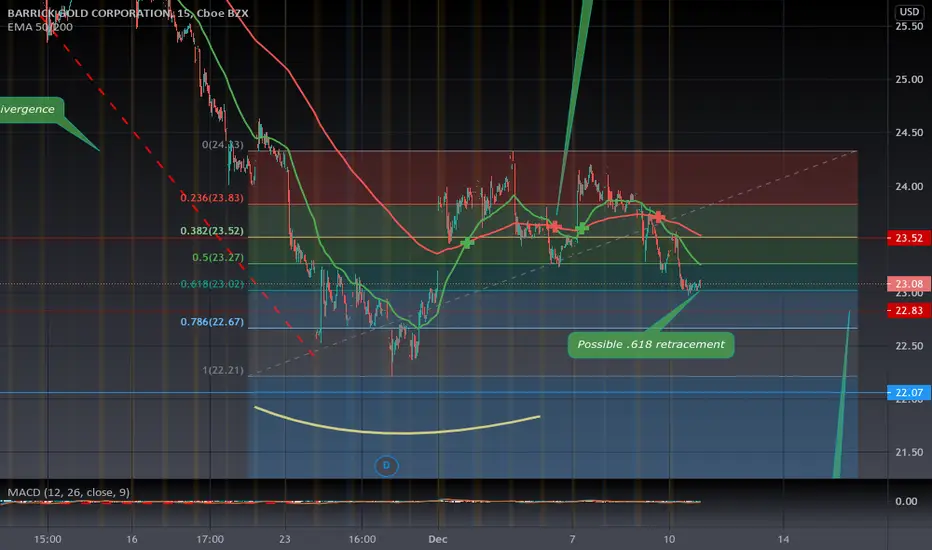
#GOLD - 1H - What price doesn't reveal. BARRICK GOLD CORPORATION.
Sometimes, price doesn't reveal all the information that the markets might tell. And then, we have to recur to other indicators like volume and hidden divergences.
In this case, we can observe that GOLD (company and metal as well too) have suffered a big hit after or in consequence of US Elections. Down almost -23% since November 6th.
From November 11th to November 24th, the price continued falling but this time, MACD formed ascending minimums. This type of correlation is known as bullish divergences (See pink arrows). Also, if we take a look at volume, there's a MASSIVE amount of operations on November 25th . This type of volume hasn't been seen since March when GOLD started its bullish rally.
The most curious about this session is that this volume took place in a tiny candle with almost none price variation and really near to support. This could be a clear sign of consolidation.
On the other side, GOLD (Metal) is showing signs that bears are no longer in control and price suddenly stopped at USD 1.800 per Oz.
We might spect lateralization with high volume over the next sessions. Then, once the price breaks USD 23.5, we can confirm our hypothesis and open a long position.

Potential Inverse H&S Gold itself has taken a beating falling from over $1900 to low of $1764 today. Gold miners, including Barrick, have followed. GOLD has support of $1735-$1750. Barrick got a little bounce today and is setting up for a potential inverse H&S pattern. If GOLD falls a bit, barrick backtests a little, and then both bounce, we could see the bullish break of the inverse H&S.


GOLD , LongI did a quick fundamental comparison of the large cap gold stocks and GOLD came in as the winner... by far , technical justifies a long position as well. I focused on forward P/E , Debt metrics and quick ratios , book value, cash per share and institution holdings and transactions. Makes sense that buffet picked this.
Good luck ~

Barrick GoldHard to believe people keep selling good stocks like this one. It's trading at 13 times earnings.


GOLD LongMonthly Chart
Double bottom + retest neck line
PlanA at current price, short term entry:
Entry 23
Stop 21.5
Target 30
PlanB at next demand Zone for long term:
Entry 21
Stop 19
Target 39
I am not a PRO trader. I need few months to practice trading strategies.
If you like this idea, please use SIM/Demo account to try it, until my trading plans get high winning rate.

GOLD: swingtradeHere we go.
*Indicators used*
-Zig Zag
-Pivots
-Vol
-MACD
-Super Trend V1.0
*Like if you find useful, thanks!*

Barrick Gold is oversoldIt looks like Barrick Gold (GOLD) is oversold on the ytd trend channel, rsi & volume ema. The metal gold $1800/oz, hasn't been this cheap since July. I know with all the hoopla about bitcoin being a hedge on inflation, I will not be surprised if GOLD makes a U-turn in the next few weeks / month and starts gaining significant value again. I guess we'll see. I picked up some $23 long calls out of speculation. Do your own due diligence, your risk is 100% your responsibility. You win some or you learn some. Consider being charitable with some of your profit to help humankind. Small incremental steps work : If you double a penny for a month it = $5,368,709. Good luck and happy trading friends...
*3x lucky 7s of trading 101*
7pt Trading compass:
Price action, entry/exit
Volume average/direction
Trend, patterns, momentum
Newsworthy current events
Revenue & Earnings
Debt / Cash
Book value, assets
7 Common mistakes:
+5% portfolio trades
Bad risk management
Emotions & Opinions
FOMO : bad timing
Lack of planning & discipline
Forgetting restraint
Obdurate repetitive errors
7 Important tools:
Trading View app!, Brokerage UI
Accurate indicators & settings
Wide screen monitor/s
Trading log (pencil & graph paper)
Big organized desk
Reading books, playing chess
Sorted watch-list
Checkout my indicators:
Fibonacci VIP - volume
Fibonacci MA7 - price
pi RSI - trend momentum
www.tradingview.com
TradingView links:
www.tradingview.com
www.tradingview.com

$GOLD - NR Picks Nov 15Barrick Gold es uno de los mayores productores de oro en el mundo, con una producción anual cercada a 5.5 millones de onzas de oro y 430 millones de libras de cobre. También posee reservas probadas de 71 millones de onzas y 13500 millones de libras respectivamente.
- El precio de su acción ha venido acumulando retrocesos desde setiembre debido a que el oro alcanzó los $2000 por onza en estas fechas.
- Actualmente el precio del metal se encuentra a niveles de $1888 (25% más alto que 2019).
- A partir de esto recodemos que compañías como Barrick saben aprovechar muy bien estos incrementos de precio, tal es así que se espera que sus ganancias incrementen 111% y otro 30% para el próximo año. Tambien consideremos que en el tercer trimestre Barrick registró un flujo de caja libre de $1300 millones, lo que le permitió elevar su dividendo un 12.5% ($0.09 dólares por acción/ 1.4% yield).
A estos niveles, el precio nos parece atractivo. Identificamos una resistencia clara en $25. y esperamos un impulso hasta los $28 nuevamente hacia la recta final del año, segun nuestros patrones técnicos.
Adicionemos a esto, el mercado en general puede registrar algo de volatilidad para estos últimos meses del año, y una probable rotación a activos refugio podría beneficiar a Barrick.
