GS SEMANA 21 - 25 OCTPendiente rompimiento de banderin after earnings posible momentun. PUT confirmar con rompimiento de 200EMA en 15min
GS trade ideas

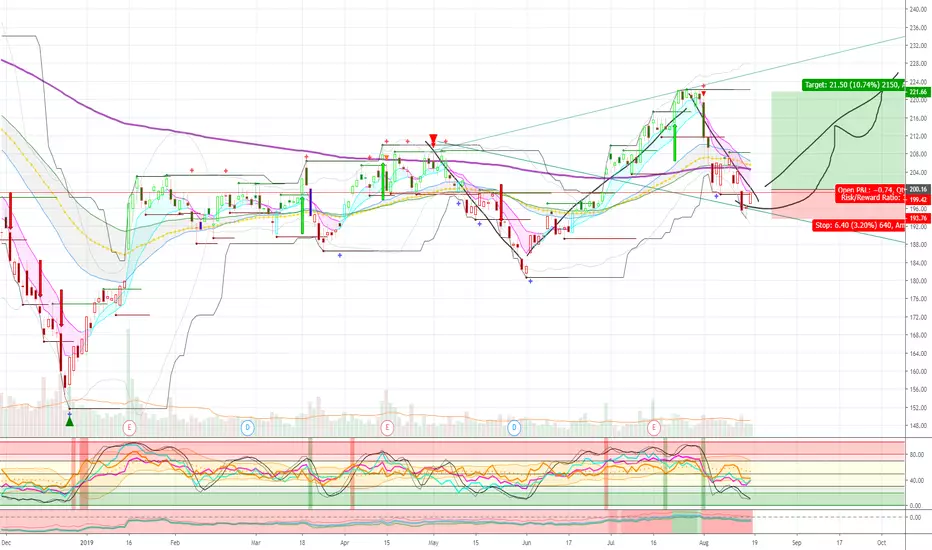
$GS Long Goldman Sachs into earningsEntry level $206 = target price $222 = Stop loss $201
Bullish indicators and price action.
Support has held on numerous occasions, limiting downside.
222 remains very strong resistance.
P/E 8.59 which is extremely low.
very reasonable 2.44 yield.
Average price target $233 | Overweight.
Company profile
Goldman Sachs Group, Inc. engages in global investment banking, securities, and investment management, which provides financial services. It operates through the following business segments: Investment Banking, Institutional Client Services, Investing and Lending, and Investment Management. The Investment Banking segment gives financial advisory services and help companies raise capital. The Institutional Client Services segment serves clients who come to buy and sell financial products, raise funding, and manage risk. The Investing and Lending segment includes investing and relationship lending activities; and making investment. The Investment Management segment involves in investment and wealth advisory services. The company was founded by Marcus Goldman in 1869 and is headquartered in New York, NY.

Goldman before EarningsGoldman Sachs failed triangle formation before earnings. Some lines and connection have been averaged with step-line over log (chart is self-explanatory).

GS - Bearish TrendBear Put Spread
bought 25th Oct $210.00 Put 8x100 $7.46
sold 25th Oct $200.00 Put 8x100 $3.51

Upside projection for GoldmanTaking a 1:1 measurement of the farthest divergence from the descending trendline applied to the point of breakout gives a potential price target of around $268.


GS, Double top aead?Will this be Double Top technical formation or heading to Fibonacci 61.8 level time will tell.
My play is short with S/L tick above Fibonacci and T/P on 3% from MA200


$GS breaking out?$GS breaking out? It broke over the $210 resistance a second time. The last time this happened was after an earnings surprise and then it got brought down with the rest of the market. A breakout over $220 would confirm. The 50-day EMA is trending up and about to cross the 200-day EMA as well. Looking for a channel to be filled up to $240 or up to $275 (depending on recession indicators).


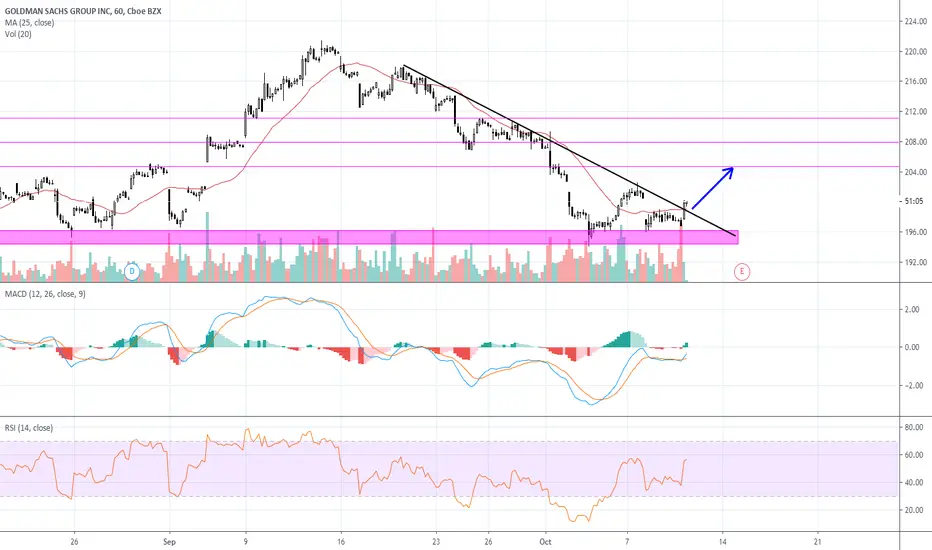
GS fell 2.42% on Tuesday trades but held on above 196.90GS - Goldman Sachs share prices fell 2.42% on Tuesday trades but managed to hold above 196.90 support level. Share prices have been on a consolidation mode for about two weeks from 204.54 to 195.00 and could continue to retest its previous resistance at 204.54 if it breaks and holds above 200.00 price level. A critical support price level is estimated at around 195.45.

GSI will take a closer look at MA200 price level and Fibonnachi 38.2.
On top of those RSI will give us a signal where the price can go.
On H4 time frame we can see some possible bullish development in front, and futures are green, at least for now


GS broadening tri, C&H, overextThis is for bullish thesis (in case of more cuts and market reacts positively). Yields ATL, TLT through the roof.


GS is getting ready for a shortNYSE:GS is getting close to a resistance cluster
it's hell of a short!
can you guess why the rectAngle is resistance???
let's see how it plays out :)

