Goldman Sachs - The Vampire Squid GS is currently trending down until the highs on the chart are gained.
Very well respected fib on the chart. Here is the fib zoomed out -
I wouldn't be surprised if the gap was filled or the 786 was tested for support.
If the 0.618 is broken then a move to the 0.5 or 0.382 is on the cards.
GS trade ideas


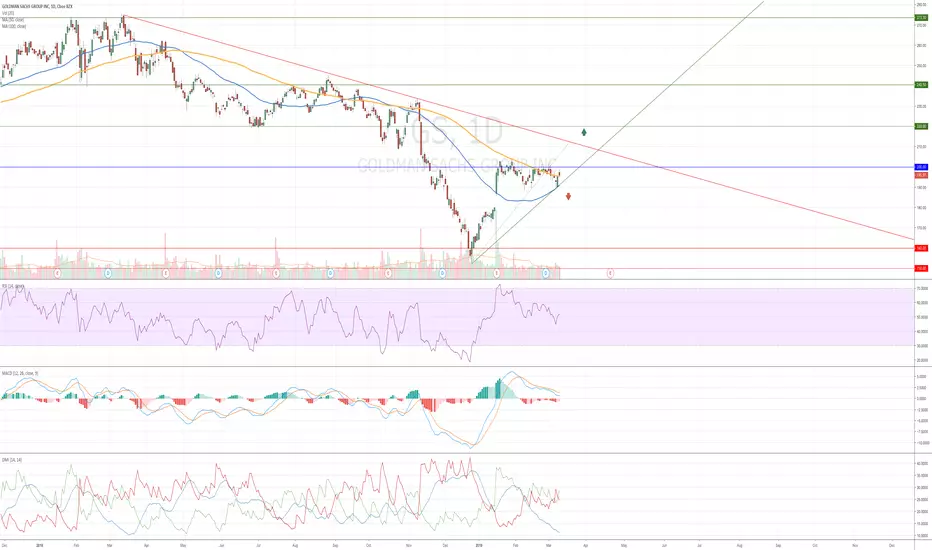
Goldman Sachs - Market OverviewThe market keeps a bearish trend. After bouncing from a support zone between 160.00 and 150.00 levels, the price moved upward to SMA100. We can see two attempts for breaking this line, but they were not successful. SMA100 and 200.00 resistance make a barrier for further upward movement, and we should expect for the reversal from this zone.
If price bounces from this resistance and drops below the local uptrend line, it will be a signal confirming further falling and continuation of the bearish trend. The breakout can be used for opening short trades with stops above 200.00 and profit targets at 160.00 level.
If the price can move above 200.00 level, we will get a trend reversal confirmation and buy opportunity based on this signal. But the upward movement can be limited by the main downtrend line. Breaking above the main trend line will give one more confirmation for the trend reversal. From that moment it will be possible to search for buy opportunities based on breakout and reversal signals. The market will be ready to start a new bullish trend.
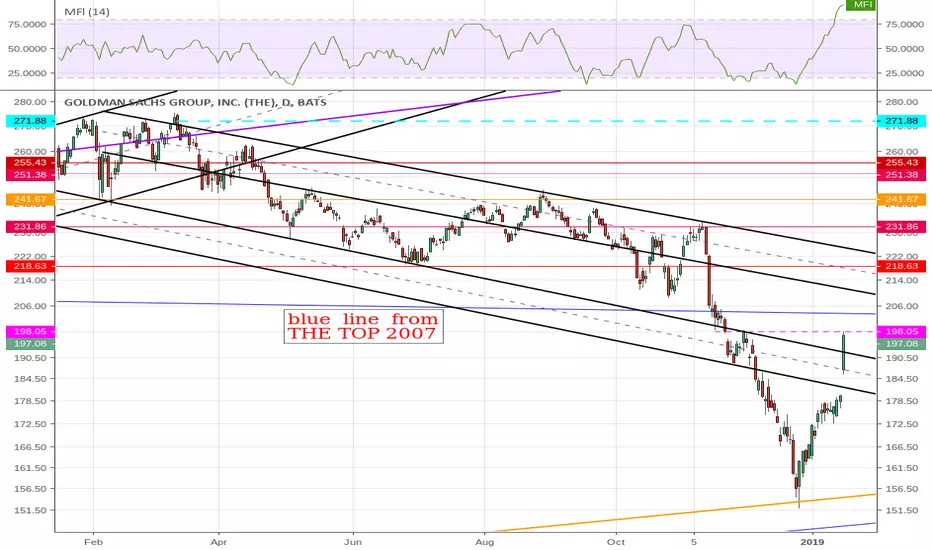
GS stopped @ previous GAP and now has gap below GAP resistance again
Blue line from the highest high and down trending
channels are resistance zones from gaps and hi/low peaks [ R&S}
seeing if secondary resistance lines are S&R - noticing gaps in these channels occasionally
GS Approaching Resistance, Potential Reversal!GS is approaching its resistance where it could reverse to its support.

GS Approaching Resistance, Potential Reversal GS is approaching its resistance at 211.21 (61.8% Fibonacci extension, 50% Fibonacci retracement, horizontal pullback resistance) where it could reverse to its support at 182.59.
Stochastic is also approaching resistance where a reversal could occur.

Goldman Sachs $GS weekly flag, volume pocket aboveGS flagging on weekly with volume pocket up to $218+ on move above $200

GS is a long with a stopGS is in a tight range. Market is trending up with potentiatly more positive news ahead on trade. 50MA is pojnting up on the daily and I believe $203 in the near term is posible. My stop is set at a close of $191.50.


GS Approaching Resistance, Potential Reversal!GS is approaching its resistance at 211.21 (61.8% & 50% Fibonacci retracement, horizontal overlap resistance) where it could reverse to its support at 182.59.
Stochastic is also approaching resistance at where a reversal could occur.

$GS long Bull flag breakout. This could test down trend line around 210-212, then some sideways action before popping over.

Goldman Sachs - GS - Bull Flag? Look for breakoutNot financial advice. Do your own research. The ideas shared here are the personal opinions of the BitDoctor team. Trade at your risk.
Took a really profitable trade on GS yesterday and got out right before it hit the top. Now I am looking for a more long term trade since we hit a bottom in intraday trading today. I'm not going to touch GS unless it breaks a key level around $200 and closes on a daily timeframe.
If Goldman Sachs can close above $200 then if I look at a measured move on this flag pattern, we are likely heading to $223 which would be over 10% from breakout (not from where we are right now which is about $192).
There are a lot of factors that one needs to consider trading right now and one of those factors is the fact that we're still somewhat stalled on trade deals with China and shaky ground in the legislative / executive branch in the USA.
Regardless, if we can break through this level and potentially retest it to confirm support, we have potential to make that strong push up. It'll take time and this is where patience could pay off. Keep the stop loss.
Trade safely friends.
<3 -CE-

Goldman is a good buyThe whole financial sector looks too risky for me with the fed halting interest rate hikes and stopping QT. GS is the exception.. and maybe AMTD.
Fib loves support at $170 12/31-1/14
Retested support at $190
If it can punch through $203 (resistance) I think this thing is mooning to $210
At the very least this is a safe trade to $203 because it has to retest that resistance
Moving avg bullish
Bullish volume because of that earnings beat on 1/14
EPS Est $4.45
EPS Actual $6.05 – +35% beat
Weekly MACD looks VERY bullish
Got in yesterday at $192.10

GS Approaching Resistance, Potential Reversal!GS is approaching resistance 211 (61.8% Fibonacci extension, 50% & 61.8% Fibonacci retracement, horizontal pullback resistance) where it could potentially revese down to its support.
Stochastic is approaching its resistance where a corresponding drop could occur.


38.2% & POSSIBLE 61.8% Retracement SHORT GWAVE38.2% & POSSIBLE 61.8% Retracement SHORT GWAVE.
FIB Retracement Percentage is calculated in a Higher Cartesian and or Euclidean Dimension.
PLEASE ALWAYS WAIT FOR STOCHASTIC CONFIRMATION!!! THANKS

GS Breakout?GS looks like it wants to break out, just needs a little help from the market. Bought calls on the morning dip, holding until tomorrow morning. Should easily be $5 when it breaks out.

Global Growth Fears Goldman Sachs Prices have perfectly aligned itself with the Fib Ratio prices. As long as the price doesn't break above the Stop loss, I will be holding a Put.
Here is my Option Trade: (Keep in mind that I am not good at options, I just see good value here as a swing option trade)
GES $165 Put
EXP date: 2/22
I will be holding this option until days before the expiration date.
If I made you money, follow me !

Buy Goldman Sachs american stocks after hitting monthly demandGoldman Sachs GS american stock buy opportunities after reaching monthly demand level around 157. This monthly demand imbalance has gained control after a strong drop for a few months.
New weekly demand level is being create at $178 as a reaction to monthly demand level, shorts are not allowed on this stock. Long term long bias with bigger picture uptrend on all bigger timeframes. Very strong reaction on the monthly off that M demand level.
We don't really care what the fundamentals are saying about this american stock, we don't care if BlackRock and Goldman Sachs Asset Management both plan to temporarily move some British-based fund managers to New York in the event of a no-deal Brexit, two sources told Reuters. Or if neither of the firms, who together employ more than 10,000 people in London, expects a chaotic exit that would force them to carry out the emergency relocation, the sources said.
Goldman's asset management business GSAM, with 50 managers in London, has plans to send "a handful" to the U.S. financial capital until a framework is in place, the second source said, adding they too would eventually relocate to the euro zone.
Goldman Sachs has reached a bigger timeframe demand level, it's time to buy with a clear long term long bias, no need to pay attention to what the fundamentals are saying. Buy opportunities being created on weekly and daily imbalances on Goldman Sachs NYSE american stocks.


Looking at GS Option Strikes after big dayI'm looking at primary support and retracement levels as well as a shot at ascending at as sharp an angle as we descended in the last month-ish.
Strikes of interest to me:
$187.5 Put for 1/18 or 1/25
$215 Call for 1/25 or 2/1
$230 Call for Mar 1
