GS trade ideas

bullishuptrend.........
pullback is completed on daily chart.....
triggered ...........
buy...........

Goldman Sachs GS Weekly Pin BarPin bar at significant level going back to April 2006
Could see lower levels possibly back to 130.00

BULLISHUPTREND.............
BREAKING OUT OF DESCENDING TREND LINE .........
PASSING OF A PIVOT...................
TRIGGERED........
BUY........


Trendbreak + Double Bottom + H&S=Long?Let the chart speak....
resists: 163,7/ 167,8/ 171,5
Support: 155,5
Comments are welcome -Agree or Disagree!


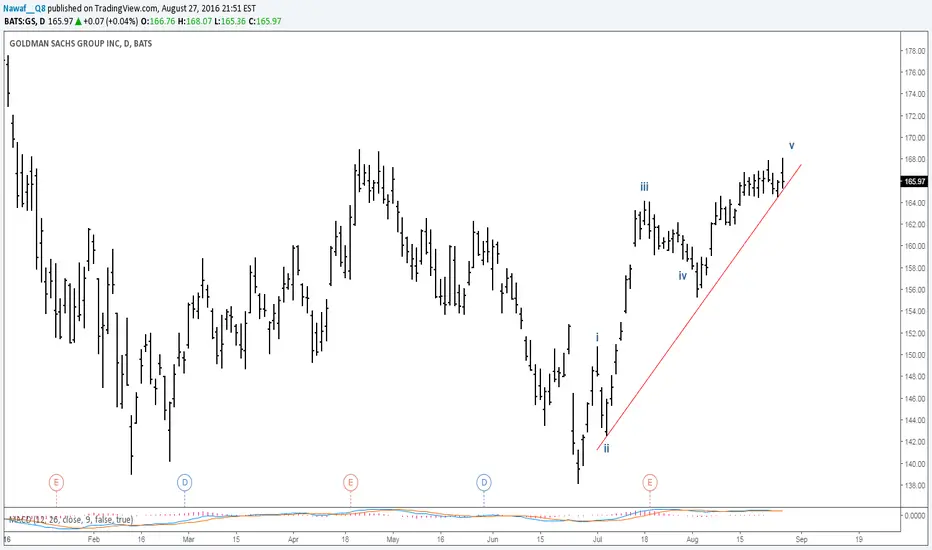
GS (Goldman Sachs) following up Stock up 10 $ as wave 5 as I mentioned last time. Currently stock is overbought and could see decline to 156 $ or around as correction wave. Other option is to break the resistance and continue to higher price. Coming days will approve one of options.
GS GOLDMAN SACHS ANALYSISGS GOLDMAN SACHS ANALYSIS
It seems we have just completed a wave 5 on the minuette period and now starting the correction wave phase?
There also seems to be divergence (check MACD 4C below) ?

Goldman Sachs – Multiple bearish patterns on daily chartDaily chart shows –
Breach of rising trend line
Bearish price RSI divergence
Money flow index turning lower from overbought territory
Prices could test long-term falling trend line support (earlier resistance) now seen at 162.50 levels. A daily close below the same would confirm trend reversal and open doors for a drop to 50-DMA.
On the higher side, only a day end close above 168.90 (Apr 21 high) would signal continuation of the rally from June 27 low.


GS Short Term Bullish b wave correction, Take profit 50% retracement
GS has been underperforming the overall Financials, XLF, we could have a little boost to complete Wave B at 50% level.

GS.. one more advanceAccording to Elliott wave count, GS is about to advance one last time as wave V to complete the correction wave. As option trader I think there is opportunity to buy some calls when price close above trendline, and SL is near the latest valley. Target is 168$. Good luck. Remember, this is short term position and the target could be reached in few days or hours.


Become a Goldman!!!!!Time to watch for Goldman Sachs. Trend line from 2009 is a very strong resistance. But guess what? Once the trend line has been breached you are the new Goldman if you know how to play. Get ready for some good options strategy. I would like to see little bit new high/high before go short. Also this is a monthly chart so better to see how the daily chart or weekly is developing. In upcoming months it will an A list to watch for short.


GS - Earnings beats estimates, will it break double bottom?Goldman has topped earnings expectations. CEO Lloyd Blankfein said the firm did well across all of its businesses, despite the uncertainty created by Britain's vote to leave the European Union.
Results highlight
Earnings per share of $3.72 and Revenue of $7.932 billion. Analysts were expecting earnings of $3 a share on revenue of $7.581 billion, according to a Thomson Reuters consensus.
Thoughts on share price
The stock is down 9% this year. What this means is despite recent sharp recovery from June 27 low, there exists a potential for further upside in the pair. Upbeat quarterly results may just be the catalyst for further upside. However, note the strong results may have been priced-in by the markets and if so we could see 'sell the fact' trade.
Double bottom on daily chart
Double bottom neckline stands at 168.90. Monday's closing is 163.33. The recent rally from June low has seen three gap up openings. The third one is usually the sign that 'dumb' money has entered. The larger falling trend line resistance is seen around 167.50.
Unless we do not see a daily closing above double bottom neckline, it is advisable to stay on the sidelines. On the other hand, a failure to take out falling trend line over next couple of weeks despite strong quarterly results could yield a fresh drop towards 140 levels.

GOLDMAN SACHS GROUP ANALYSISGOLDMAN SACHS GROUP ANALYSIS
It seems that we are at the start of a wave 4 on the minute period ?

Great Opportunity on Goldman SachsOn 19th there will be some volatility from the Earnings and we might see these movements.

Goldman Sachs (GS), LONG possibilityHere os a Chart of GS, were I try to show a possible strong uptrend. GS suffered great percentage falls after BREXIT. I see optimism in the stock, and a possibility to make a good profit.

Weekly S-H-SThe only problem I see is the 78 % retracement of the rise since February and that the current price is very close to the closing price of February. This could spur another retracement to the upside befor the S-H-S target will be rechaed.

goldman reached TP 1
The illustrated H&S of my former view (
Goldman Sachs near the neckline!
Prices below 177 --> TP1: 170
Prices below 170 --> TP2: 153 / 145 / 123
If the Support @ 170 will not be bought --> Sell Goldman!)
got triggered, the TP1 reached. These ays, we can see the next bearish wave, the next shortsignal. TP is the max. TP of the H&S
