HD analysis once again.Afted the run up it has retraced down forming a nice falling wedge.
I expect it to move up again soon to retest 340.
Great longterm play.
Good be a good entry!
HD trade ideas

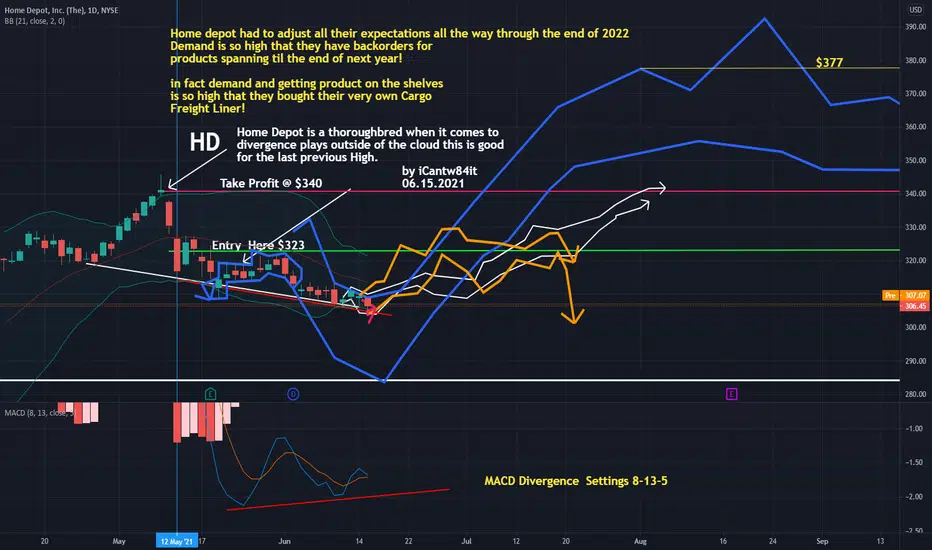
HD MACD Divergence play + they bought a BOAT!White is the preleminary key code I made - Most probable because Price action has bounced off the 20 EMA at the current price level.
Blue is a more recent and aggressive key code.
Orange is litterally the move right behind the current one.
If you follow any of the videos I make I talk about my millionaire mentors setup for Divergence plays. You will notice about the time all the option chains end I tend to make a video about a divergence play. Because, when all else fails, finding thorough bred stocks like HD, GS, RRR, ACM that only move across the top of the Bollinger Bands on the Daily , when combined with a dip down to the bottom BB creates a Divergence almost every time. These Divergence plays are the strongest plays and have a high success rate. the trick to them is giving them enough time to pan out. 32 Days is the avg amount of candles it takes to finish a complete move from one BollingerBand to the next.
That said HD is creating a huge divergence play. Setting up for perfect timing as they just had to adjust all their profit expectations all the way through 2022! Demand and backorders for product is so high for Home depot they had to buy not rent, not secure a larger portion of cargo containers on a boat.....But buy an entire Cargo Freight Liner to go and pick up all the product they need for their stores so that they dont have to continue capping the amount of product to each store to sell. Just so every store gets a chance to sell the product.
The next 1.5 years for Home depot is going to be another major Growth Period for them. Between them and Lowes they command 30% of a sector for Home improvements which is nearly 800billion dollar industry to date. Which is said to become a $1 Trillion Dollar industry by 2022!
Its all because americans love to spend money on fixing their houses. Covid made them stay in their homes and actually spend time looking at everything that needed or could be upgraded. With Free Time and Money in form of Stimulus Checks, guess where they spent both. Now that restrictions have been lifted and people are getting back to normal work conditions spending in these areas are said to increase and continue to grow as new living conditions and habits have been made. People will go out and reintegrate themselves with society but a even stronger devotion to home has been made.
Thats all I have , happy trading and pls comment , like, subscribe as its the only way I know you actually enjoy charts like this.
Thank you,
by iCantw84it
06.16.2021
HD Divergence play with KeyCode Paths + they just bought a SHIPMy millionaire Mentor Richard taught me his divergence play set up and said if HD ever comes down start looking for Divergence.... So here we are. We have Divergence and Keycode is set to a strong play in the past where price action is contained inside of it at at least 95% or better.
I made a key code of the price action then found an exact match to this move in the past.... one that matched at lease 95% or better. That way if the move is that close to the same shape we have now it must mean the sentiment of the market was the same at that time. Therefore, the outcome should be the same coming out of the move. I then used PTP which is Past Trend Prediction by tracing the trend it made after this move in the past and projecting it forward on to the current move.
Then I took the same move on the Daily which is a different Time frame then the first..and found the same move with out a key and traced its path and projected it forward as well.
Sometimes I use about 5 other Price Action tricks I have have developed over the last 10 months or chart out the Curve and what Stage it is in. The Curve is my own brain child and I compare that to Wycoff method. Taking all of these into account You have several different approaches to confirming direction and intent of the institutional buyers and where Retail resides during this move.
If you would like to have more information or videos on Any of the ways I chart pls comment below. Like, follow, Subscribe...share.
Thank you,
iCantw84it
06.15.2021

IRON TARIHi guys,
this is an inverter iron condor, 4 weeks and strike 3%. We have 14% probability to end ITM, so 86% probability that our inverted condor gets the maximum profit!
RR is pretty nice too, becuase selling @305$ and @325$ with 5$ spread, max profit is 200$ and max loss 300$, but we win the max profit 86 times out of 100.
Subscribe for free to get access at my indicator.
Enjoy your wallet!
Tari.

HD potential reversal Watching HD here for a potential reversal here. If we can reverse here my target will be around 321 again, so I'm looking at the July-August 320/325 debits. LOW has been in a tight range the past week. So maybe HD will just do the same? Going to have to wait and see who takes the lead.

Home Depot Undercuts and Holds Recent LowHousing stocks like Home Depot pulled back hard in May as the real estate market slowed. However, the bears may be throwing in the towel.
The main pattern of interest on this chart is support materializing around $310. This was near the low on May 19, the same session that HD bounced at its 50-day simple moving average (SMA). It’s also near a price gap on April 5, immediately after the long Easter weekend.
While this price area isn’t very obvious, stabilization here could be bullish. After all, HD just broke support at its 50-day SMA. That should be bearish, but where are the sellers ? Perhaps there are none.
Next, housing stocks were overbought a month ago and had a sharp pullback. (HD’s 7.1 percent crash on May 11-12 was its worst two-day drop in over a year.) But now volatility is ebbing.
Finally, stochastics have been in oversold territory.
The overall macro environment remains positive for housing. Interest rates have calmed and the economy continues to improve. Numbers like starts and sales were very weak in April, but the underlying supply/demand balance remains favorable. That may draw more buyers to HD in coming weeks if it remains above the $310 area.
TradeStation is a pioneer in the trading industry, providing access to stocks, options, futures and cryptocurrencies. See our Overview for more.


Home Depot Short IdeaHead and shoulders pattern with a clear break of the neckline. I am looking for a flush to the ledge of the volume profile.

Home Depot H&S?Home Depot stock printed what looks like head and shoulders formation on daily chart with divergence with PPO and long doji as a head. Can it break neckline? It’s tying today. If price breaks down, logical price target should be around $285

Home Depot is in TroubleLumber prices are going to severely hurt HD
Currently low interest rates will keep demand high enough to keep lumber high
The average homeowner has largely crossed HD off their shopping trip as they wait for prices to normalize. This lack of regular business is going to bring HD down sharply if lumber remains inflated.
Watch the numbers the next couple of quarters, things are going to get ugly.

HD to test 200dmaLooks like HD is near the top channel, likely to revert to the 200dma & previous breakout area.

HD PotentialSMI very low and it looks like it wants to bounce off of 50MA. Good earnings as well - could attract more buyers. Looks oversold tbh

$HD with a Bullish outlook following its earnings #Stocks The PEAD projected a Bullish outlook for $HD after a Negative Under reaction following its earnings release placing the stock in drift D
If you would like to see the Drift for another stock please message us. Also click on the Like Button if this was useful and follow us or join us.

HD 5/13off my target of 339 by $5 posted on 3/9, completing wave 5.
see related ideas for 3/9 chart
if my analysis of ES/SPY is correct, great short opportunity here. targeting breakout level

HOME DEPOT5 waves up just concluded we should expect a corrective phase ABC to complete the structure

HOME DEPOT Home Depot trading in strong zone...cuurently in One hour correction phase ... But can buy above 327 with SL 315 AND RIDE IT TOWARDS 375 IN NEXT ONE MONTH...
IF IT BREAK SUPPORT LINE THEN IT WILL ENTER IN THREE HOUR CORRECTION PHASE WHICH WILL TAKE STOCK TO LEVELS 285 IN NEXT 3 MONTHS


Follow-up analysis $HD positionNYSE:HD
One thing I do different about this specific option strategy is the trade analysis that I do for trade management. This would determine if I exit early at half of the debit or see it to expiration and risk full loss.
Initial trade set up triggered entry 04/21 Debit Put Spread $300/325 14 May 21 expiry. Price needs to be below $325 at expiration for this trade. Since Price is showing weakness and overextension. Holding this spread 'til expiration.

HD Home Depot Divergence Play good for $340Home Depot is a thoroughbred when it comes to divergence plays and is good for the last previous high when its outside of the cloud like it is now.
by iCantw84it
05.14.2021

$HD if we start pulling back...I'm looking at this as well maybe to $330-$335 before earnings...maybe that's a stretch...

Congrats :DA good technical analysis is regardless of timeframe, market condition and type of product. Stocks, currencies, metals, index, crypto, future etc.......Just one same method :D

HD about to murder people on earnings NYSE:HD
If you haven’t been long HD over the years or below $250 just don’t. Like don’t even think to buy that stock. If you bought that stock above $300 just sell it now and buy me a drink later. Your welcome. Cover Call to the max!!!
Great stock, Great company, Crazy price.... let it cool off. Don’t believe me look at AMZN after earnings

