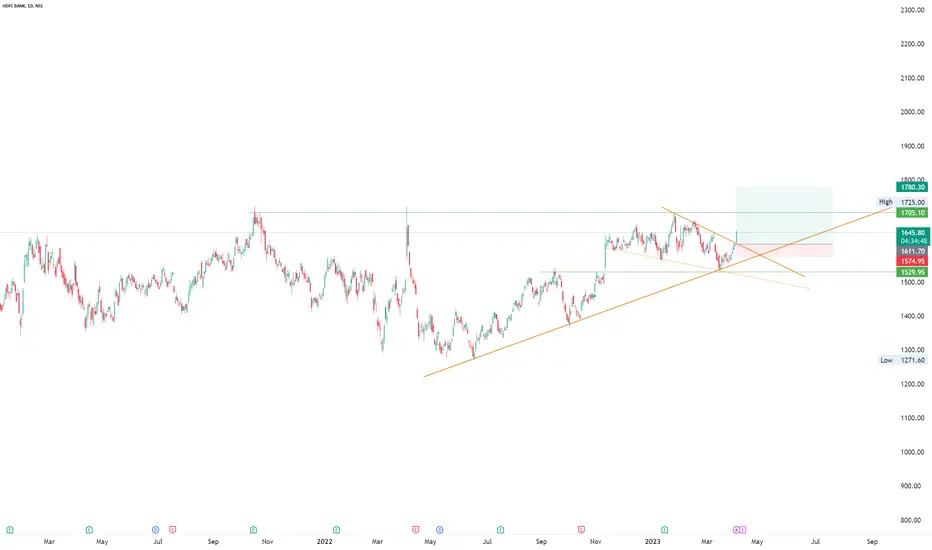
HDFC BANK -ACCUMULATION ZONE - 1543 to 1500
-SL 1450
Market Cap
₹ 9,00,433 Cr.
Current Price
₹ 1,611
High / Low
₹ 1,734 / 1,272
Stock P/E
19.6
Book Value
₹ 446
Dividend Yield
1.18 %
ROCE
6.85 %
ROE
18.6 %
Face Value
₹ 1.00
Promoter holding
25.6 %
EPS last year
₹ 82.4
EPS latest quarter
₹ 22.6
Debt
₹ 17,84,970 Cr.
Pledged percentage
0.00 %
Net CF
₹ 41,330 Cr.
Price to Cash Flow
43.3
Free Cash Flow
₹ 17,390 Cr.
Debt to equity
7.22
OPM last year
61.7 %
OPM 5Year
61.6 %
Reserves
₹ 2,46,772 Cr.
Price to book value
3.60
Int Coverage
1.79
PEG Ratio
0.98
HDB/N trade ideas

HDFCBank June expiryRudrajit deb
@fernroad
·
9m
#HDFCBank at CMP 1604 is a long opportunity. Can use option route for 1684 target.
65% fibonacci correction from recent peak of 1727
Current level for next upmove

HDFC BANK SHOWING POSITIVE PRICE ACTION Hdfc bank looking very strong according price action
for short term 1700 target possible
if closing above 1700 we can see sharp and quick move till 1800/1900

HDFCBANK--First Short then Long??HDFCBANK::
Bullish view From 1580 and 1540 range::
----->>
HDFCBANK currently trending downwards....
we have a bearish gap left @1680 zone....
that will again push the price downwards....look here for sell @1680 zone...
we have demand zones placed @1540 range will take the price again upto 1740 range...
look here for buy to continue in the short term long.
short term Bearish View from::
1640 zone::

HDFCBANK--Weak Support @1600 ??Observations::
After a strong fall price is not able to break the previous high,
and price is exactly now @ support,looks like its weak @1600 levels.
if price breaks 1600 levels,price fall is observed upto 1580 and 1540 levels.
Don't go for sell in HDFCBANK, it may reverse at any place in this levels.
look here for buyside until bearish gap filled on above 1640 and 1680 levels.

Be cautious with Longs in HDFC Bank if it fails to Break 1650 Index is moving in a LL pattern and possibly it may hit 1565 Level in this series.

HDFC at supporting Trendline, possible ATH breakoutHDFC bouncing off from supporting trendline. Possible targets 1740 and 1900.

HDFCBANK--Consolidation??Observations::
This is also continuation update of HDFCBANK Analysis::
In my last update about drop base drop formation.
the demand zone is restrict the price to go down, witness a consolidation stage is observed in HDFCBANK,
we have to see if price drop continue to 1590 range, then we expect a rise from this zone,
if acts as support we will see again the previous drop (gap down) may be filled on upside.
Consolidation + fall = rise from demand
consolidation + rise= fall from Supply
keep track this.
The One reason for BANKNIFTY is in Consolidation is their more contributors SBIN and HDFCBANK are in consolidation.
If this information is helpful give me like. Thanks.

Hdfcbank at do or die level On daily time frame of hdfcbank which is following rising channel, support at 1626 is channel support, if it fails to sustain 1626 then massive fall ,if sustain above 1626 then again move in upward direction

HDFCBANK 15M (19/5/2023)NSE:HDFCBANK
important levels and fibonacci levels are drawn in the chart.if it sustained near 1653 then more high possible .
Hello traders ,
All important levels are drawn in the chart.Work with risk reward ratio. not taking a trade is also a trade.
A trade cant change anything keep in your mind,if you think one trade can change your life then you are doing gambling in the market.take calculated risk.
DISCLAIMER- We are not a SEBI registered advisor.this is only for educational purpose. before taking trade take advice from your financial advisor.We will not be responsible for your profit and loss.

HDFCBANK--Drop-Base-Drop form??Observations:
if demand acts as Supply, fall is going to happen from here.
previous strong bullish from 1680 level, if acts as price turned to be bearish in HDFCBANK.
------->>After trending upwards, a strong breakout is given above 1700 level, with consolidation ,which is previous resistance got broken strongly.
------->>Now with opening a huge gap down, showing bearish pressure pushes the price towards downside, if this is a sign of reversal in HDFCBANK,
It's an opportunity to enter short again from these levels.
-------->>Keep on sell side as long as price is near 1680 levels. previous strong upside movement is happens here, which may acts as bearish turn in HDFCBANK. Keep look at this level it may turn bearish again.
if price again breaks 1650 levels be on sell side to 1630,1610 levels.

Short on HDFCBANKDouble Rejection From Supply Zone
Trendline Rejection will move SL to BE
Area to Watch out for support is 1450
Final Target 1270


HDFCBANK--Bull Trap or Bear Trap??Observations:
------->>After trending upwards, a strong breakout is given above 1700 level, which is previous resistance got broken strongly.
------->>Now with opening a huge gap down, showing bearish pressure pushes the price towards downside, this is not a sign of reversal in HDFCBANK.
It's an opportunity to enter long again from these levels.
-------->>Keep on buy side as long as price is above 1600 levels.

HDFC 19th April (Head and Shoulder Pattern)HDFC Head and shoulders pattern if it breaks 1654 then it can go all the way till 1580.

HDFCBANK 4h SMC HomeworkPlotting SMC Structure in HDFCBANK 4h
few confusions to be cleared in next discussion

HDFCBANK UPSIDE RALLYHDFCBANK upside potential...very bullish on upside after a 6% drop...next upcoming levels 1680 / 1700 / 2000.
Rally is definately on the up side...good buying opportunity from here.

HDFC Bank NSE:HDFCBANK
H&S pattern
Gives us a target of ₹1940
Entry at bottom of right shoulder
Entry point i.e. Green box: ₹16000
Gains: 20%
Entry at the break out of H&S pattern
Entry point: ₹1760
Gains: 10%
Duration: 3-4 months
*Not a financial advice.
My charts speaks louder than words.
I'm a chartist and I paint charts.

HDFCBANKNSE:HDFCBANK
One Can Enter Now ! Or Wait for Retest of the Trendline (BO) Or wait For better R:R ratio
Note :
1.One Can Go long with a Strict SL below the Trendline or Swing Low of Daily Candle.
2. Close, should be good and Clean.
3. R:R ratio should be 1 :2 minimum
4. Plan as per your RISK appetite
Disclaimer : You are responsible for your Profits and loss, Shared for Educational purpose
HDFC BANKThe Beast is ready to fire BNF to ATH and above if it give closing above the horizontal line tine can long this counter for a good upside.

HDFC BankHDFC Made a Double following while following the upper trend. Which is likely to fall from there and might get a rebound.

HDFCBANK-Double TOP Forms @ATH ??HDFCBANK is at its All time High. again Reversed from ATH.
bullishness is continue or Reversal May Happen.
A strong selling pressure is observed at 1700 level ,look at the reaction at 1680 levels to go upside or downside.
if acts as Support price is moving upwards otherwise downwards. keep an eye at these levels.

HDFCBANKConfluence:
=About to break market structure
=Market space
LONG @ 1692
Stop loss @ 0.50%
Target @ 1%
Disclaimer
ONLY FOR EDUCATIONAL PURPOSE.
