HOOD Breaks Out: Eyes on $84–95 as Momentum Surges Above $70If HOOD holds above $70, momentum can carry it to $84–85 in the short term, and as high as $95 if the rally becomes euphoric — but any breakdown below $70 likely resets the move.
1. Price Action – Clean Breakout
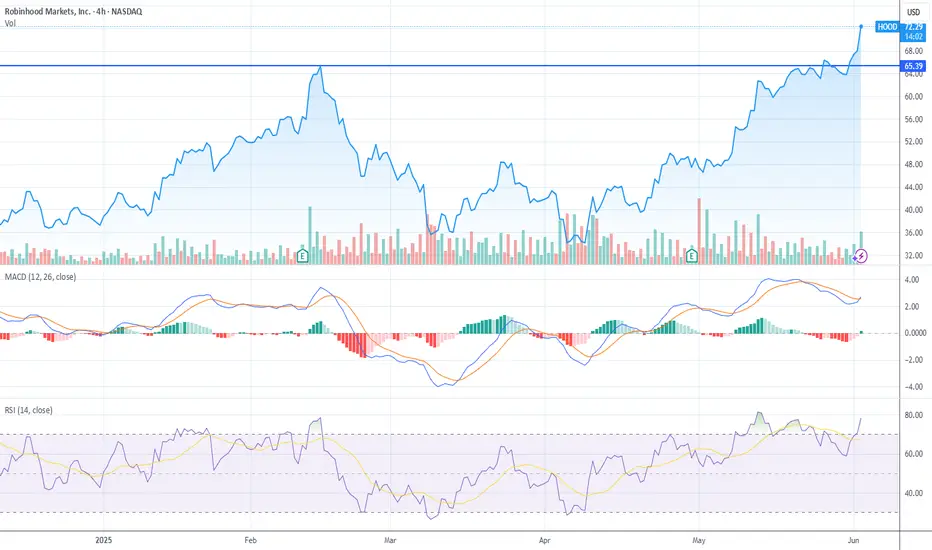
Price surged above a major resistance level around $65.39, which had previously capped price in late March. The breakout candle is strong, impulsive, and supported by volume, suggesting institutional follow-through.
2. RSI – Overbought Territory
RSI is 78.06, a red flag for short-term exhaustion. While strong trends can keep RSI over 70 for extended periods, moves like this often lead to:
Sideways digestion
Quick shakeouts
Potential for bearish divergence if price pushes higher but RSI rolls over
3. MACD – Elevated and Peaking
MACD lines are still bullishly stacked, but the histogram is flattening. We may be nearing a momentum apex — any softness in price could trigger a MACD rollover, especially on this lower timeframe.
4. Volume – Legitimate Strength
Volume on this breakout is clearly elevated, which confirms this is not a false move — at least not yet. Buyers are showing up, and that raises the bar for sellers to reclaim control.
Summary: Breakout Confirmed, But Cooling Risk Rising
HOOD has launched through resistance with conviction, but both RSI and MACD suggest this leg may be nearing exhaustion — watch for follow-through or failure in the next two sessions.
Where can this go?
Fibonacci Extension (From March Low to May High)
Using:
Swing low (March): ~$35
Swing high (May): ~$65.39
Pullback low (May 23rd): ~$60
Fib Extensions from this leg:
1.0x = $65.39 (already cleared)
1.618 = ~$84.27
2.0 = ~$95.39
That gives us a confluence zone at:
$84–85 (1.618 Fib + Measured Move)
$95–96 (2.0 Fib — extended run)
Bullish on this one
HOOD trade ideas
Robinhood, Breakout
Uptrend
A strong resistance level at approximately 67, which also called an all-time high, has now been broken after about 12 days by a good bullish candle. While some traders are initiating long positions immediately, others are waiting for further confirmation above this level. More conservative traders might prefer to wait for a pullback to broken level before entering. Overall, I anticipate a mid-term target of around 80-82. It's crucial to emphasize the importance of setting a firm stop-loss for your position; I recommend approximately $62.
Good luck.

HOOD Breakout from Ascending Triangle — Targeting $70+
📝 Full Description (for TradingView Idea Post):
Ticker: NASDAQ:HOOD
Timeframe: 30-Min Chart
Trade Type: Long (Breakout Play)
HOOD has formed a clean ascending triangle pattern over the past several days, showing higher lows converging toward the horizontal resistance at $68.00. This pattern typically signals a bullish breakout when price pressure builds toward the resistance zone — and that's exactly what we've just seen.
The stock has broken above this resistance zone with momentum, confirming the breakout. I entered this trade on the breakout candle and am now watching for price continuation toward the next key level.
📊 Trade Plan:
Entry: $68.00 (confirmed breakout)
Stop-Loss: $69.06 (just below previous consolidation high)
Target 1: $70.38 (based on measured move from triangle height)
Risk/Reward: ~1:2.2
📌 Technical Highlights:
Ascending triangle breakout
Higher lows confirming bullish structure
Breakout from compression zone on decent momentum
Resistance flip zone now likely acting as support ($68.00)
📉 Candle Behavior:
Clean breakout candle with decent follow-through suggests traders were watching this level. If volume continues to support, we could see a strong move to the upside.
📈 Next Resistance: $70.38
🧲 Support to Hold: $68.00 zone
🦅 Chart by ProfittoPath
Follow for swing trading setups, breakouts, and educational ideas.

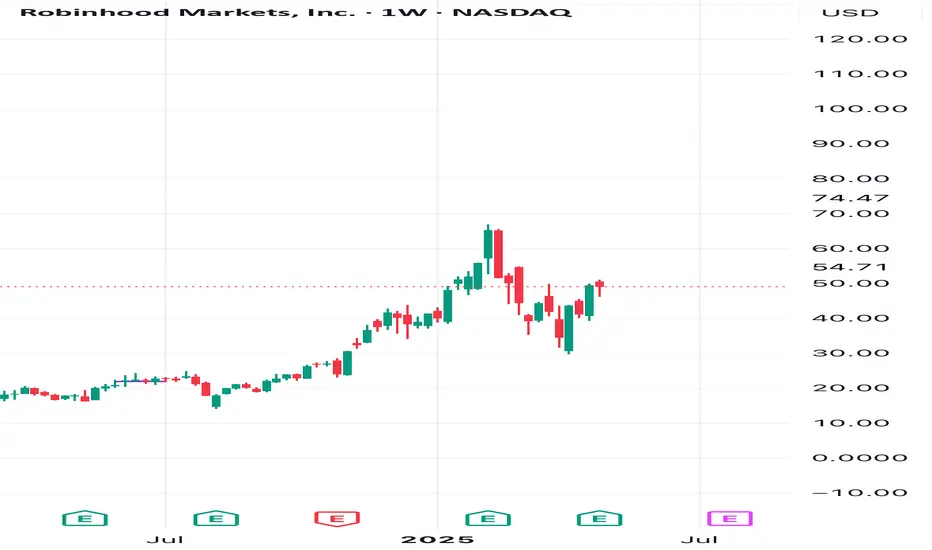
$HOOD great product but short term pull back here $58-$60Hello, I have multiple time frames up here: Daily, Weekly, and Monthly. I love Robinhood NASDAQ:HOOD as a broker, product and revolutionary company in the financial space. This is a great long term hold equity wise in my opinion but right now I am looking to short this name for a necessary pullback into $58-$60. It's overbought on the big time frames as you can see highlighted, it is possible it can break out of course but I believe with declining weekly volume this name will resort to some pullback. Also, Bitcoin can have some downside as well which will bring this name down with it. This ticker is volatile and can move 5-8% in either direction in just one session. I am looking for $60p about 3 weeks out, 6/20 date.
WSL

Key LevelPrice is consolidating around a critical key level 67.15. Even though price appears to be forming an ascending triangle at that level, we have at this time bearish divergence with price and volume and with price and the oscillators (RSI, Stochastic RSI and CCI). Price must break with intense volume or form Higher Highs and Higher Lows above the 67.15 key level to maintain bullish momentum.

$HOOD weekly cup and handleNASDAQ:HOOD trying to play out a weekly cup and handle formation. Looking for bullish confirmation with a candle close over $66.89. Inverse head and shoulders pattern played out on the daily chart already so a pullback to 60 may play out first.

From Retail Relic to Rocket ShipBoys. We caught the full ride on Robinhood. From that juicy accumulation zone around $10.67 (blue line support) all the way up to the $60+ euphoric blowoff… now I’m sipping $30 smoothies in silence

Call on RHIm expecting a call/buy on RH because I see that price has come down to a lower level of support and resistance. As long as ema's don't cross down, we should expect price to go upwards.

HOOD on its way to ATH! Let's send it folks! Daily TF - It has completed 5 waves downtrend and ABC correction that confirmed reversal. Currently on an uptrend and it has completed 4/5 waves. 5th wave is underway or any short term correction is an extension of 4th wave as long as wave 1 high is not breached.
Monthly TF - It is trying to reclaim the 0.886 fib level on monthly. A close above this is going to send it, only a few more days left in the month for confirmation.

HOOD crossroads📈 Robinhood (HOOD) is at a crossroads. The chart looks clean and promising — but some indicators are flashing mixed signals. Who will win this battle: price action or the indicators? 🤔
Let’s see who tells the truth this time. #HOOD #Stocks #TradingThoughts

OptionsMastery: Looking for a breakout on HOOD!🔉Sound on!🔉
📣Make sure to watch fullscreen!📣
Thank you as always for watching my videos. I hope that you learned something very educational! Please feel free to like, share, and comment on this post. Remember only risk what you are willing to lose. Trading is very risky but it can change your life!

Robinhood, WonderFi and hidden gems with massive upside?📢 Big News: Robinhood (NASDAQ: HOOD) is Buying WonderFi for C$250 Million
Robinhood just announced it’s buying WonderFi, a major hashtag#Canadian hashtag#crypto company that owns popular platforms like hashtag#Bitbuy and hashtag#Coinsquare. The deal is worth almost C$250 million where WonderFi shareholders will get 41% more than what their shares were worth just days ago.
💥 Why This Matters:
Robinhood is going global: this move gives them a big entry into the Canadian crypto market, which already has over C$2.1 billion in assets.
More crypto tools for users: WonderFi brings advanced technology that will help Robinhood grow its crypto trading, staking, and storage services.
Stronger team: WonderFi will keep running with its current team, and they’ll now be part of Robinhood’s growing presence in Canada.
🧠 What Could Happen Next?
This shows Robinhood’s plan to be more than just a U.S. trading app - it wants to become a global platform for crypto and finance. If all goes well, and regulators approve the deal, it could push the stock higher. As the chart shows, the price is getting close to previous highs, and good news might send it even further.
📅 The deal should be finished by late 2025.
hashtag#Robinhood hashtag#HOOD hashtag#Crypto hashtag#WonderFi hashtag#Fintech hashtag#Investing hashtag#NASDAQ hashtag#Trading hashtag#Canada

HOOD LONGIn a long position on HOOD, With crypto making nice moves, and Hood being a large holder, Could benefit.
H&S got wrecked on the macro, inverse H&S showing strength after the breakout following BTC. a lot could happen with red folder news this week, $70 Im looking for soon.

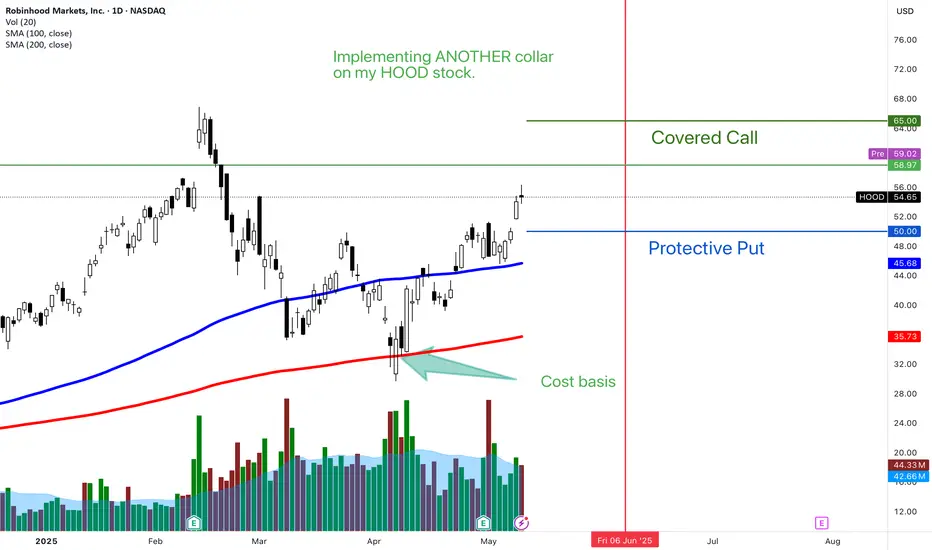
HOOD COLLAR againA collar is when you use options to protect your downside. The perfect collar , you have a put option above your cost basis and a sold call that pays for it. This expires first Friday in June. Looking for HOOD to continue higher over time. BUT , a great stock to buy low, sell high.
Uptrend set to continueNASDAQ:HOOD Uptrend remain intact and is set to continue higher after the stock has broken out of the downtrend corrective channel/bullish flag. In this retrospect, the stock is looking at a terminal end to the corrective 3-wave move.
Long-term MACD is looking at a return of a long-term upside momentum after histogram turned positive. Stochastic oscillator confirms its oversold signal and 23-period ROC is back above the zero line. Elsewhere, volume is in a healthy expansion!

HOOD eyes on $49.16: Golden Genesis fib that may End BounceHOOD recovering nicely from the tariff bottoms.
Currently orbiting a Golden Genesis fib at $49.16
Looking likely to retest next fib below at $45.44

HOOD daily chart: breakout or fakeout? Key zone approaching.Robinhood's stock has formed a falling wedge pattern on the daily chart, indicating a potential bullish reversal. The price has broken above the 0.618 Fibonacci level at $44.00, suggesting further upside potential. Next targets are $48.40, $52.79, $58.22, and $67.00. RSI and MACD indicators confirm bullish momentum.
Fundamental Factors:
Robinhood continues to show revenue and profit growth, supporting positive investor sentiment. The company is expanding its services and attracting new users, strengthening its market position.
Scenarios:
Main scenario: continued rise to $48.40, then to $52.79 and higher.
Alternative scenario: pullback to $39.71 with potential decline to $36.00.

HOOD – Inverse Head & Shoulders + Ichimoku Cloud BreakoutRobinhood (HOOD) has broken out of a strong inverse head and shoulders pattern and cleared the Ichimoku Cloud, confirming a bullish trend shift. Both price structure and trend indicators support continuation.
Trade Setup:
Entry: $52.50
Stop Loss: $49
Target: $80
Risk–Reward: ~1:7.8
With volume picking up and bullish technical confluence, this breakout could trigger a move toward the $80 level — a major psychological and structural target.
#HOOD #IchimokuBreakout #InverseHeadAndShoulders #TrendReversal #BullishMomentum #SwingTrade NASDAQ:HOOD

Break of channel , New wave downside, Algo short, wave downwards, break of trend.
There is 10% downside or more atleast, the market have gone up very much already and could be a healthy retracement.
$HOOD Weekly RecapNASDAQ:HOOD Weekly Recap
Market Structure: Price remained confined within the downtrend, failing to break out. Watching for more macro-positive catalysts that could help push it above the trendline.
Market Bias: The recent pullback aligns with broader market sentiment and may serve as a foundation for a potential move toward previous highs.
BX-Trender: The weekly BX-Trender histogram showed improvement, hinting at a possible reversal on the horizon.

HOOD LONGRobinhood is showing strong signs of accumulation and trend reversal on the higher timeframes. Price will double from where it is at currently. Thank me later!
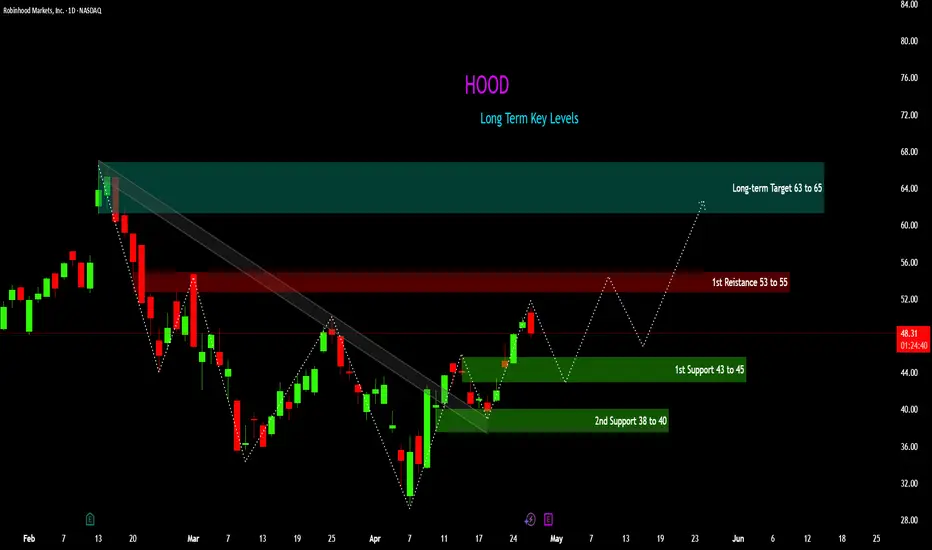
HOOD Long Term Key LevelsIdentified Key Levels for HOOD for Long-term Holding
Disclaimer:
The information provided on this TradingView account is for educational and informational purposes only and should not be construed as financial advice. The content shared here reflects personal opinions and is not a recommendation to buy, sell, or hold any financial instrument. Trading and investing involve substantial risk and are not suitable for every investor. You should carefully consider your financial situation and consult with a financial advisor before making any investment decisions. Past performance is not indicative of future results. We do not guarantee the accuracy, completeness, or timeliness of the information provided. Use the information at your own risk.
$HOOD - channel breakout HOOD - Stock about to break out of channel on daily. however after stock did break that level. watching for calls above $45 for a move towards $50 and higher. Company to report earnings next week. Looking for pre earnings run up
