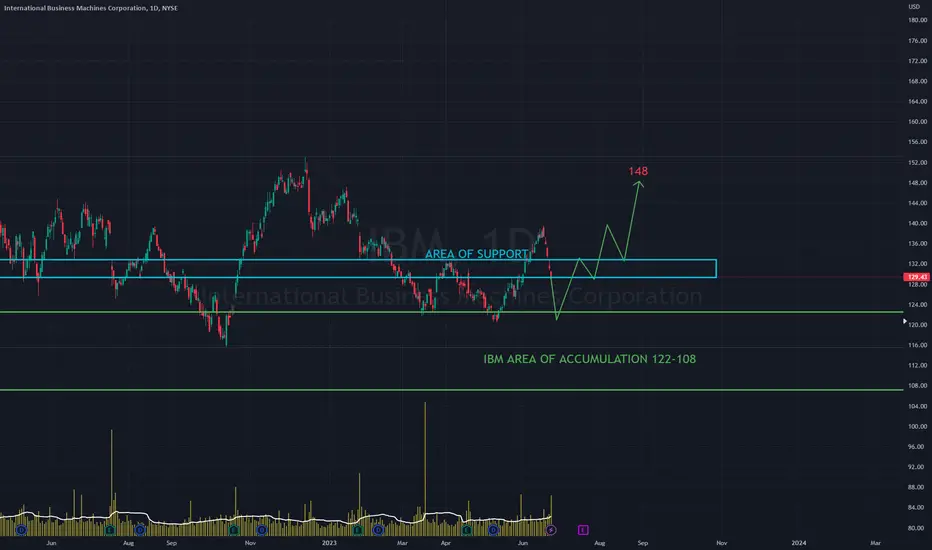
IBM Long - B wave formationIBM continues to consolidate after dropping down the A wave. If enough buying power comes in this should begin the B wave. Look for a target of around $145. Consider buying options 2 Fridays out once this is confirmed.
IBM trade ideas

Neutral on IBM. Looking more bearish.
As you can see here we are at a demand zone. But, we are consolidating at this zone and that usually means we break through the zone. If we bounce off of the zone, I will look for it to retest the recent trendline that we have just broken. But, if we break through the zone, I will be looking for the stock to fall all the way down to the bottom Bollinger Band on the weekly chart. The P/E ratio is at 65 which is very high so I am leaning more bearish. Also, the market as a whole has an extreme fear index which could also signal a bearish ride for this stock. On the weekly chart, we were over-extended from the top Bollinger Band and have been red the last two weeks so I do look for this downtrend to continue. If we fall, this could be a money-making monster for a couple months out put and I feel we have more room to go down then up. My overall opinion is that we might go up in the short-term but the long term we could be headed for a landslide to the downside.

IBM, This is Huge, Massive BULL-Acceleration, BREAKOUT-Setup!Hello There!
Welcome to my new analysis of IBM. In recent times I have analyzed the stock and I have detected major important historical determinations within the analytics backend that are actually indicating an epical breakout has a high potential to emerge within the next times. Not every stock within the market is bullish however with IBM there are clear signs that it already had the potential to rebound since the grievous corona market shock lows and now as digitization increases this is already building a bullish base for IBM.
Within my chart, I have detected this gigantic inverse head-shoulder formation in combination with the paramount bull flag formation, both being two bullish formations that have the potential to be major bullish trend accelerants once the breakout above the boundary has shown up this is going to activate a major double confirmation here. The trend is supported by the major underlying demand structure as well as the EMAs and the main ascending trend line. Once the final breakout above the upper boundary of the inverse head-shoulder formation in combination with the upper boundary of the bull flag has shown up this is going to accelerate the demand trend dynamics.
Taking all these factors into consideration here as digitization since the corona pullback lows have been completed increased massively this is increasing the actual digitization demand within the market and for a stock like IBM, this means that there is a main underlying demand base that is accelerating a bullish trend dynamic. Once the main breakouts as mentioned within the next times have shown up this is going to activate the minimum target of 250 and above further continuations have an increased potential once the main demand and momentum spread into the trend direction increases. Because of the importance of this setup forming here, I am keeping the stock in my current watchlist.
In this manner, thank you everybody for watching my analysis of IBM. Support from your side is greatly appreciated.
VP

IBM: Navigating the Cloud and AI Era for Smart InvestmentsIBM: Navigating the Cloud and AI Era for Smart Investments
When Arvind Krishna assumed the role of CEO at IBM in 2020, he embarked on a transformation journey for the iconic tech giant, steering its focus towards cloud computing and artificial intelligence (AI). As this transformation reached its fruition, the rejuvenated IBM experienced a notable surge in its share price on September 20, following an "outperform" rating bestowed upon it by Matthew Swanson, an analyst at investment bank RBC Capital.
A Strategic Pivot for the Future
Considering the company's strategic pivot towards the thriving domains of cloud computing and AI, alongside the recent endorsement with an "outperform" rating, the question arises: Is investing in Big Blue a logical choice? Several compelling factors support the notion of acquiring IBM shares. However, it's worth noting that IBM's stock price has experienced an upward trajectory in recent months, currently hovering close to its 52-week high.
Warren Buffett's Wisdom
As the venerable Wall Street figure Warren Buffett has articulated, "For the investor, a too-high purchase price for the stock of an excellent company can undo the effects of a subsequent decade of favorable business developments." With this sage advice in mind, let's delve deeper into the company to assess whether IBM constitutes a prudent and promising long-term investment.
Dominating Cloud and AI
IBM stands out as an enticing investment option primarily due to its unwavering focus on two dynamic domains: cloud computing and artificial intelligence (AI). The company has honed its specialization in the hybrid cloud market, catering to clients seeking a blend of dedicated IT infrastructure for heightened privacy and shared infrastructure for cost efficiencies.
Within the cloud computing landscape, IBM ranks among the top six companies in terms of market share, positioning itself advantageously to harness the robust growth of the hybrid cloud sector. In 2021, this market was valued at $85 billion, and experts predict it will surge to an impressive $262 billion by 2027.
IBM's extensive experience spanning decades has propelled it to the forefront of the AI arena. Notably, IBM made history in 1997 when its AI technology defeated the reigning world chess champion. The company's latest AI offering, Watsonx, which was launched in July, has rapidly found favor with over 150 businesses, including prestigious institutions like NASA. Watsonx even played a pivotal role at Wimbledon by generating tennis commentary.
Quantum Leap in Technology
Moreover, IBM is actively involved in the development of quantum computers, which hold the key to unlocking more powerful iterations of AI. Quantum computers possess the ability to process vast volumes of data at unprecedented speeds, and IBM holds a prominent position as a leader in the burgeoning field of quantum computing.
Revenue Growth and Resilience
IBM's strategic technologies have propelled the company's revenue growth over the past three years, showcasing its resilience and adaptability. In the second quarter, which concluded at the end of June, the Red Hat division, the core of its cloud computing business, experienced an impressive 11% revenue surge. Simultaneously, the data and AI segment recorded a commendable 10% increase. Both segments fall under IBM's software business unit, which contributed significantly with $6.6 billion in Q2 revenue.
Strong Free Cash Flow and Dividend Track Record
IBM's prowess in technology adoption among its clientele also fuels revenue expansion in its consulting division, which aids clients in integrating the company's technical solutions. This segment achieved a 4% increase in Q2 sales, reaching $5 billion. Collectively, IBM's software and consulting divisions accounted for a substantial 75% of the Q2 revenue totaling $15.5 billion.
Furthermore, IBM boasts the capacity to generate dependable free cash flow (FCF), a crucial metric representing cash available for business investments, debt servicing, and dividend disbursements. By the close of Q2, the company had accumulated $2.1 billion in FCF and anticipates reaching $10.5 billion for the year, marking a substantial increase from the previous year.
IBM's robust FCF empowers it to maintain an attractive dividend yield, currently exceeding 4%. Impressively, IBM has consistently paid dividends since 1916, boasting 28 consecutive years of dividend increases.
Assessing the Share Price
Notably, while IBM has seen growth in its software and consulting divisions, its Q2 revenue of $15.5 billion experienced a marginal 0.4% decline compared to the preceding year's quarter. This dip was primarily attributed to a reduction in sales within its infrastructure segment, responsible for hardware sales like computer servers.
However, IBM anticipates year-over-year revenue growth of at least 3% in 2023, adjusting for currency fluctuations. In fact, when currency fluctuations are accounted for, Q2 year-over-year revenue exhibited a 0.4% increase.
Yet, investors may scrutinize IBM's share price, which currently hovers near its 52-week high. Nevertheless, RBC Capital analyst Matthew Swanson has set an optimistic price target of $188, marking a 30% increase from the current price.
Conclusion
To gauge IBM's potential, let's consider its forward price-to-earnings ratio (P/E), factoring in consensus price estimates from various analysts. In comparison to cloud competitors Microsoft and Oracle, IBM holds the lowest forward P/E, potentially indicating that its stock is undervalued relative to its peers.
However, it's worth noting that the average price target from analysts currently stands at $147 for IBM shares, aligning closely with the stock's current valuation. Therefore, substantial appreciation in IBM's stock price at its current level seems unlikely.
Nonetheless, IBM's high-yield dividend offers the prospect of consistent passive income over the years. With its strong foothold in the cloud computing and AI markets, coupled with robust FCF generation, IBM presents itself as an appealing long-term income stock.
Our preference
Above 132.00, look for 146.00 and 150.00

IBM Bearish Pattern!!!When taking a look at IBM, we an see that it has had an impressive climb over the past few weeks. This bullish climb is also printing a bearish reversal pattern. The rising wedge breaks out to the downside more than it breaks upward. With this being said and the price action approaching the end of the wedge, i would expect a drop from these levels to the next support around 5% down.
If you end up taking a trade, use risk management so you don't lose more than 1%-2% of your account per trade.
Every day the charts provide new information. You have to adjust or get REKT.
Love it or hate it, hit that thumbs up and share your thoughts below!
Don't trade with what you're not willing to lose. Calculate Your Risk/Reward!
This is not financial advice. This is for educational purposes only.

IBM show a small level double topIBM show a small level double top
This figure shows the weekly candle chart of IBM's stock from the end of 2019 to the present. The graph overlays the bottom to top golden section at the beginning of 2020. As shown in the figure, IBM's stock tested the 2.000 position of the bottom up golden section twice in December 2022 and this month, completing the small level double top form! So for a period of time in the future, use the bottom of the graph to match the 1.618 position of the golden section as the watershed to judge the strength of IBM's stock!

IBM - Triple top!Triple top at 152 rejected by a hefty red bar this week. If the bar's low is convincingly broken as price breaks out of the wedge, (quite a bit) lower prices likely.

IBM shortRising structure was broken, but wen back to structure so after a test back short will be open.

Sell limit for IBMAssuming existing ownership of IBM stock. Using fibs, potential sell limit orders can be placed. The low sell limit has more odds. The highest sell limit could happen (you never know). The higher you go, the more chance you're taking it will reach that price at some point. Question is, how badly do you want to sell?

IBM rising wedgeIBM has been forming ascending wedge pattern. We expect the price to brake down.
The short position can be taken once the price breaks down of the rising wedge patter. Estimated target is 134.17 but we should wait for the break down to measure the exact target and setting stop loss.
Another way to trade this pattern is to wait for a breakdown and enter short once the price retest the resistance (current upsloping support) and gets rejected to the downside.
Good luck

Bearish Alert : IBMOn the hourly the price which is still recording positive price action following the long term uptrend, popped out a bearish alert with EMAs testing each other.
On Watch for a possible deeper pullback

Rising WedgeRising Wedges are Bearish but are not valid until the bottom line is clearly broken.
A level of support will usually catch price if it/when breaks down. This wedge is accompanied by several indecisive candles at resistance.
Both lines slope up and narrow at the apex.
Sometimes price will break up from a Rising Wedge, but eventually price will break the bottom line. It can be a long time in some cases.
A Rising wedge represents a supply overload within the wedge.
No recommendation

IBM testing resistanceInternational Business Machines (IBM) testing long-term channel resistance, able to absorb monthly buying pressures.
From here, (IBM) can fall lower to channel support, eliciting losses of 5-10% over the following 1-2 months.
A settlement below this channel support would lead to significant losses through 2024.
Inversely, a weekly settlement above channel resistance would push (IBM) to our next notable level of resistance.

IBM Bear Call SpreadSell $150 call Buy $160 Call
Pro: Strong Line of resistance at $150, S&P trading high
Cons: Upwards Trend line since May, should reach at $150, suspect trend line will disappear once hits resistance.
Note: Stop loss at $155

📈📊 #ChartPattern Alert! 📈📊 📈 Rising Wedge 📈📈📊 #ChartPattern Alert! 📈📊
📈 Rising Wedge 📈
📈 What is a Rising Wedge? The Rising Wedge is a bearish chart pattern characterized by two converging trendlines, with the lower trendline sloping upward more than the upper trendline. It typically signals a potential bearish reversal, with the price likely to break downward after the wedge pattern.
📈 How to Identify:
Draw a trendline connecting at least two lower highs (upper trendline).
Draw another trendline connecting at least two lower lows (lower trendline).
📈 What it Signals: The Rising Wedge suggests a potential bearish reversal, with sellers prevailing at lower highs within the wedge. It often forms during uptrends and can precede a significant price move to the downside.
📈 Trade Strategy:
Consider short-selling or setting stop-loss levels if the price breaks below the lower trendline of the Rising Wedge.
Set profit targets based on the pattern's height subtracted from the breakdown point.
Implement a stop-loss to manage risk in case of a false breakdown.
Remember to use other technical indicators and conduct thorough research to support your analysis before making any trading decisions. Happy charting and trading! 📉💹

Bearish Alert : IBMNew bearish alert for NYSE:IBM on the hourly chart.
Our EMAs are having a test right now.
Price action will record a new low below $142.20 together with a bearish crossover.

AI vs Quantum Computing AI? Pfft, please. Quantum computing is where its at.
The AI generation is here. Stocks are pumping because of it, people are crazed because of it and its going to “revolutionize” the world as we know it.
How precisely it will change the world, well I could fathom some guesses. But the question is how will it change trading? And the answer, which is entirely speculative but based somewhat on research, is kind of surprising.
It won’t. But something will. And that something is quantum computing.
Let me explain to you the likely reasons that AI is not going to “revolutionize” trading in the sense most people, I think, feel it will, and how quantum computing will. And keep in mind this is coming from someone who relies 100% on computing, algorithms and, to a lesser extent, natural language models to program and develop trading models. All of my trades are executed based on statistical models that were programmed using excessive amounts of computing resources and, in some cases, natural language models.
At the end of the day, AI will not revolutionize trading as AI is only as smart as natural law and mathematical theories.
The assumption that AI is going to revolutionize trading is contingent on the fact that there is something that AI can do that people, algorithms or computers themselves cannot. And the reality is, there is nothing that AI can achieve that is not already known. Market makers and financial institutions make millions if not billions each year based on statistical models and computational algorithms that execute these models in trading. AI is not going to change that. The information is already known. The question isn’t “what in the data don’t we know”, the question is “how fast can we mine this data to modify our models to adapt to changing market conditions”.
On average, for me to program a statistical model of a stock, I can do a haphazard one in a bout 30 minutes. This will not be a perfect model but it will be a functional model that would have anywhere from 70% to 85% accuracy. Theoretically, AI would be able to execute the same task in probably maybe half the time as me, but this is essentially only because of cutting the manual labour. The computing time required may actually be a bit longer. Why? Because the computing power needed is vastly greater. We need the computing process to run the AI model IN ADDITION TO the computing power needed to power the statistical analyses of the data.
For me, on average, it takes my Microsoft Surfacebook Pro with an AMD Ryzen 5 2.30 GHz and 8 GBs of RAM about 25 to 30 seconds to processes the creation of a basic model when I incorporate only basic trading data.
If I bring in volume data and have it calculate distributions and price accumulations within bell curves and have it run multiple probability simulations, the processing time can range from 1.5 minutes to hours, depending on the size of the dataset.
Que the quantum computer. Theoretically, a quantum computer could perform this task in under 5 seconds. How? Well its complicated, but essentially quantum computers operate on something called a “Qubit” vs a normal computer which operates on Bits (i.e. bits per second).
Bits are sequential. So the computer will execute each task sequentially, which takes time. Qubits are able to execute multiple tasks simultaneously. Hence reducing the processing time.
AI is not exempt from the bits rule. It processes things sequentially and has to also make room for the fact that it is processing a natural language model in addition to other models required for statistical computing, thus increasing the processing demand and reducing the speed and efficiency of processing.
The major ability of large financial institutions to make money comes from their ability to processes multiple streams of data, from order flow data, to regression models, to probability distribution modelling, to running simulations such as monte carlo simulations of potential outcomes and finding which model fits based with the current price action. All of this requires incredible processing power, processing power that not even AI is going to be able to manage. However, quantum computers, on the other hand, are ideal candidates for processing these large amounts of information efficiently, accurately and, most importantly, quickly.
Quantum computing will be able to track order-flow, create simulations based on order flow and current price action and predict and fit the most likely outcome of price trajectory based on real time data. If I were able to have order flow access, like actual order flow access that is only available to financial institutions and exchanges, and connect this to my computer, draw monte carlo simulations as well as instantaneous regression models based on this and historical behaviour and have my computer model and fit the current PA and order flow information to the most reliable simulation within the confines of a broader regression model, I would be accurate probably 95% of the time if I had to haphazard a guess. The issue is, I do not and not even financial institutions have the computing power required for such a thing.
Theoretically there could be over 5,000 different likely models. Computing all those models and fitting the PA to each of them would require … that’s right.. a quantum computer.
That said, AI has been found in the research to serve a unique purpose in terms of trading and financial information. And that is in processing fundamental and news related data. Research has already demonstrated positive outcomes from using AI models to interpret fundamental and news related data on stocks. Goldman sachs has invested huge amounts of money investing in AI research which, among other academic and financial institutions, have lead to very positive findings in AI’s ability to interpret how fundamental, economic and earnings data will impact stock trajectory (if you are interested, the title of a published article that researched this is titled “A comparative study on effect of news sentiment on stock price prediction with deep learning architecture”).
The reality is, both AI and quantum computing will have profound benefits to those who can afford them. The richer will continue to get richer. But the most profound impact on direct trading will come, in my opinion, from quantum computing. Because the inherent process of stock price prediction is related not so much to the ability of AI to processes language data, but the ability of a computer to processes price action and order flow data and model it accordingly. This does not require AI. It just requires algorithms.
It probably won’t surprise you to learn that the biggest investors in quantum computing are … big financial institutions. And if you look at the top investors for quantum computing, its predominately all financial institutions. If you look at the top investors in AI, financial institutions don’t even comprise half the list. Yes there are some financial institutions, but they are not the rule. There is more diverse interest in AI than in quantum computing, which, I believe, speaks volumes to the implications of quantum computing vs AI in the financial sector.
Me personally, if I had to pick between owning a fully capable AI model vs a quantum computer, I would pick quantum computer. Because I know my process works but it is limited by the limited computing power I have. A quantum computer would be my ticket to richness. AI would be meh.
Thanks for reading everyone and as always, safe trades!
And I also just want to quickly give a shout out to IBM. IBM currently leads the world in quantum computing and initially lead the world in AI (google IBM Watson if you don't know), and yet their stock continues to under-perform the rest of the market.

$IBM with a bullish outlook following its earnings #StocksThe PEAD projected a bullish outlook for NYSE:IBM after a positive under reaction following its earnings release placing the stock in drift A with an expected accuracy of 66.67%.

IBM Options Ahead of EarningsIf you haven`t sold IBM here:
Then analyzing the options chain of IBM International Business Machines Corporation prior to the earnings report this week,
I would consider purchasing the 135usd strike price Puts with
an expiration date of 10/20/2023,
for a premium of approximately $4.90.
If these options prove to be profitable prior to the earnings release, I would sell at least half of them.
Looking forward to read your opinion about it.
IBM: Processing… 💻IBM is still processing wave b in red – the second step of a three part downwards movement, which should soon lead to the low of wave B in turquoise. As soon as wave B in turquoise is complete, the share should turn upwards to climb above the resistance at $139.47. There, IBM should conclude wave 2 in green before a significant downwards movement should take hold. However, there is a 35% chance that IBM could rise above $139.47 directly to develop a new top of wave alt.A in turquoise first before turning downwards again.

Mega running triangle in the makingI inadvertently stumbled upon the chart of IBM last night and I was intrigued with the pattern that has developed over the past thirty plus years since 1999 (the dot.com crisis).
Economists and market analysts have been talking about the US economy undergoing a recession of late because of the interest rate hike and the sticky inflation, with the US stock market showing signs of bearishness.
I am not on the side of the bearish camp and I believe that we are currently undergoing a correction which will end in the foreseeable future. The financial stocks are a good harbinger for the US economy and I believe the correction of the financial stocks is going to end soon. I have been using goldman sachs as a proxy. I will post my analysis of GS when the right opportunity arises.
Back to IBM. I reckon it is on the path of completing the wave E of the 'mega' running triangle that has developed over the 34 years as depicted on the weekly chart. Let me expound on it.
Wave A : W -X - Y formation. W is a flat, followed by X, and Y is a zigzgg.
Wave B : The longest wave in the triangle that explains why we are getting a running triangle. I will breakdown wave B into a W-X-Y formation. Wave W is a abc pattern. I will label this as a elongated flat. 'a' wave is a leading diagonal follow by a steep descent, wave b, and a five waves 'c' wave. Wave X is a regular flat pattern followed by Wave Y, a triangle. It may be difficult to see the triangle legibly on the weekly chart, but can be viewed visibly on the daily chart. Wave B is labelled as a double combination wave. Elongated flat (W)-(X)-triangle (Y).
Wave C : It is a classic zigzig abc pattern. 'a' wave is a five wave impulse pattern with third wave extension. 'c' wave is a expanding ending diagonal.
Wave D : It has sufficient waves to label it as a W-X-Y pattern, but corrective waves are tricky. A decisive breakdown below 125 will give a good indication that wave D is completed and that we are on the path to wave E
Wave A, B,C and D ( white label) are all but corrective three waves. Once wave E is completed in the region of 100. IBM will be riding on its impulse wave C (orange label) to a new high. IMHO.

Major Inflection, Good Dividend PlayMultiple supports lining up, ribbon of emas is lining up, and MACD is building momentum against price action.