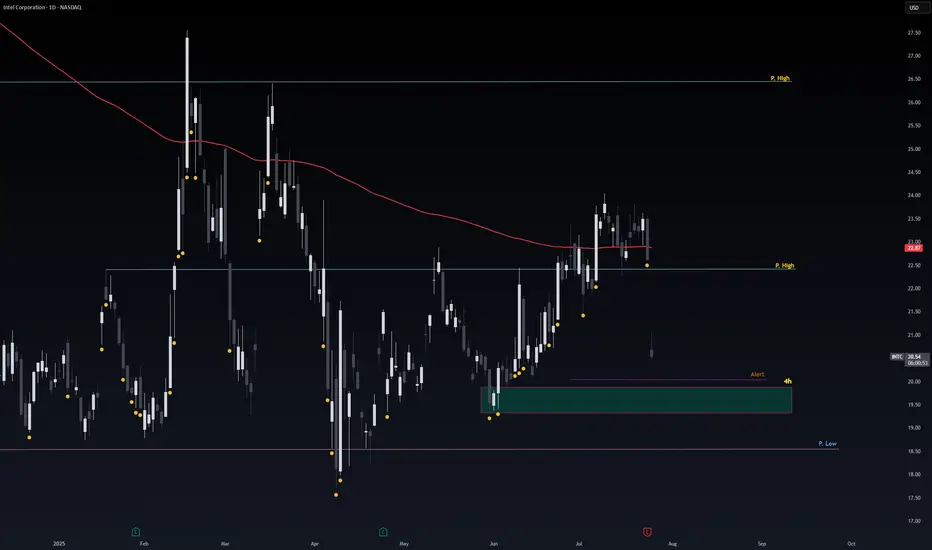
Safe Entry IntelThe 4h Green Zone is Safe & Strong Support for Intel.
If not respected the Pink Line is Second Strong support level.
Note: 1- Potentional of Strong Buying Zone:
We have two scenarios must happen at The Mentioned Zone:
Scenarios One: strong buying volume with reversal Candle.
Scenarios Two: Fake Break-Out of The Buying Zone.
Both indicate buyers stepping in strongly. NEVER Join in unless one showed up.
2- How to Buy Stock (safe way):
On 1H TF when Marubozu/Doji Candle show up which indicate strong buyers stepping-in.
Buy on 0.5 Fibo Level of the Marubozu/Doji Candle, because price will always and always re-test the
INTC trade ideas
NVDA to save IntelThis may be one of the best entries you get to intel in your life time. NVDA just announced today that all of their new super computer systems are utilizing Intel chips alongside NVDA chips. This is going to push a huge surge in demand for Intel, and also help them get back on track with creating chips that the market/future market actually wants/needs.
This gives actual opportunity for Intel to turn the ship around and lead to years if not a decade of growth.
Hugely risky play. GL

Intel: Still Not Cheap Enough?Intel has been falling for years, but some traders may think it’s still not cheap enough.
The first pattern on today’s chart is the series of higher lows since April, combined with lower highs since February. That converging range is a potential consolidation pattern.
Second, the chipmaker broke that range by gapping lower on Friday following a weak quarterly report.
Third, traders may eye $17.67 as the next important level. That April low was also the lowest price since August 2010.
Fourth, the 50-day simple moving average (SMA) inched toward the 200-day SMA this month but failed to cross above it. Is a longer-term bearish trend in effect?
Next, the 8-day exponential moving average (EMA) is below the 21-day EMA and MACD is falling. Both of those signals may be consistent with bearishness in the short term.
Finally, INTC is an active underlier in the options market. (Its average daily volume of about 350,000 contacts ranks 10th the S&P 500, according to TradeStation Data.) That could help traders take positions with calls and puts.
TradeStation has, for decades, advanced the trading industry, providing access to stocks, options and futures. If you're born to trade, we could be for you. See our Overview for more.
Past performance, whether actual or indicated by historical tests of strategies, is no guarantee of future performance or success. There is a possibility that you may sustain a loss equal to or greater than your entire investment regardless of which asset class you trade (equities, options or futures); therefore, you should not invest or risk money that you cannot afford to lose. Online trading is not suitable for all investors. View the document titled Characteristics and Risks of Standardized Options at www.TradeStation.com . Before trading any asset class, customers must read the relevant risk disclosure statements on www.TradeStation.com . System access and trade placement and execution may be delayed or fail due to market volatility and volume, quote delays, system and software errors, Internet traffic, outages and other factors.
Securities and futures trading is offered to self-directed customers by TradeStation Securities, Inc., a broker-dealer registered with the Securities and Exchange Commission and a futures commission merchant licensed with the Commodity Futures Trading Commission). TradeStation Securities is a member of the Financial Industry Regulatory Authority, the National Futures Association, and a number of exchanges.
Options trading is not suitable for all investors. Your TradeStation Securities’ account application to trade options will be considered and approved or disapproved based on all relevant factors, including your trading experience. See www.TradeStation.com . Visit www.TradeStation.com for full details on the costs and fees associated with options.
Margin trading involves risks, and it is important that you fully understand those risks before trading on margin. The Margin Disclosure Statement outlines many of those risks, including that you can lose more funds than you deposit in your margin account; your brokerage firm can force the sale of securities in your account; your brokerage firm can sell your securities without contacting you; and you are not entitled to an extension of time on a margin call. Review the Margin Disclosure Statement at www.TradeStation.com .
TradeStation Securities, Inc. and TradeStation Technologies, Inc. are each wholly owned subsidiaries of TradeStation Group, Inc., both operating, and providing products and services, under the TradeStation brand and trademark. When applying for, or purchasing, accounts, subscriptions, products and services, it is important that you know which company you will be dealing with. Visit www.TradeStation.com for further important information explaining what this means.

To Frustration and Beyond! Welp... That Was That. And I Guess I Was Wrong.
(For now.)
Bears gonna bear, bulls gonna bull, and Intel’s still out here quietly building the Death Star while everyone’s chasing squirrel stocks hitting all-time highs. Yeah, we’re not mooning yet, but I still believe INTC will outpace most of the market on a YTD basis 2–3 years from now. Why settle for 50–100% gains when there’s a potential 200–400% monster comeback on deck? Even a smooth double to $50/share would dunk on most “safe” tech plays.
Analysis (a.k.a. my hopium-fueled thesis):
I’m still convinced this setup mirrors Pat Gelsinger’s 2023 run — but this time, without the rug-pull. Intel’s trimming the fat, locking in on its foundry moonshot, and going full Dragon Ball Z with a “laser focus” on margins and product execution. When they finally deliver a quarter with positive GAAP and non-GAAP EPS and beat expectations? That’s your ignition point for the mother of all squeezes. Until then, they’re still checking boxes and marching toward the target.
This sell-off? Overcooked.
I’m still holding, still in my leaps, and I’m not even thinking about touching that sell button until we fly past $70+.
Remember when people clowned AMD before Lisa Su pulled off the Zen-volution?
Yeah. Intel’s setting up for their own comeback tour. And I’ve got front-row seats. 🧠🚀📈
I'm still in it. Shares + Leaps....
You know the drill...
Disclaimer:
I am not a licensed financial advisor. The information provided in this content is for entertainment and informational purposes only, and should not be construed as financial or investment advice. All investments carry risk, and you should do your own research or consult with a qualified professional before making any financial decisions. Past performance is not indicative of future results. I may hold positions in the securities discussed.
Intel to 40. A bet on America's chip when the chips are downIntel is an interesting stock. I made a bet on it this week. It’s very cheap trading at book value. Lots of bad news has destroyed this stock while other chip stocks are at all time highs. With a new CEO running the show and investing in next gen chip production, I think he turns it around.
I think it's at 40 within a year, and makes new all time highs after that.

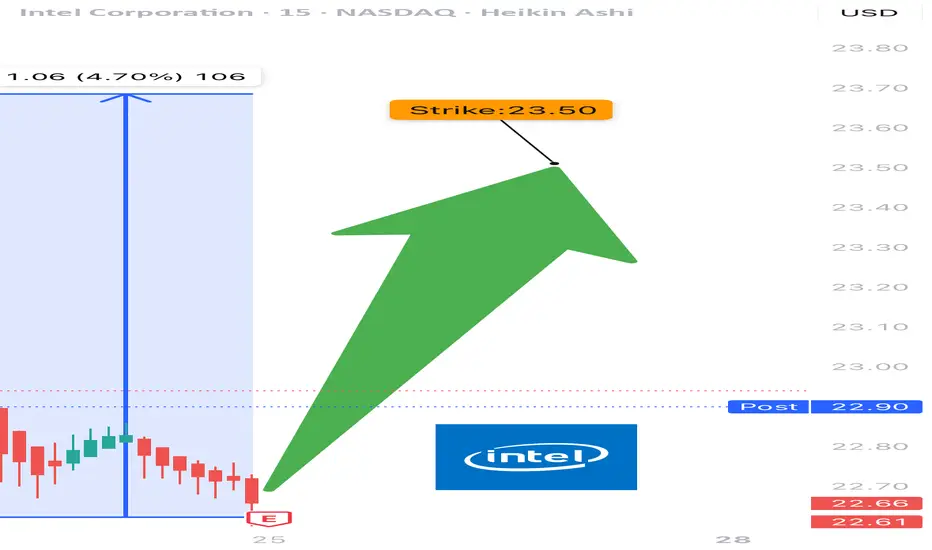
INTC EARNINGS TRADE (07/24)
🚨 INTC EARNINGS TRADE (07/24) 🚨
🎧 Earnings drop after close — here’s the high-conviction setup 📊
🧠 Key Highlights:
• 💥 Surprise Beat Rate: 88%, avg surprise = 419%
• 📉 Margins: Ugly (-36% net margin) but improving sentiment
• 📈 Volume Surge + $24 resistance test = pre-earnings drift 🚀
• 🔎 Mixed options flow → cautious bulls leaning in
• 🎯 Sector: SEMI = 🔀 rotating hard, competition vs AMD/NVDA rising
💥 TRADE SETUP
🟢 Buy INTC $23.50 Call exp 7/25
💰 Entry: $0.59
🎯 Target: $1.18
🛑 Stop: $0.29
📈 Confidence: 75%
⏰ Entry: Before Earnings (Close 07/24)
📆 Earnings: Today After Market (AMC)
📊 Expected Move: 5%
⚠️ Play the earnings drift → gap up = profit. Miss = cut fast. Risk = defined. Reward = explosive.
#INTC #EarningsPlay #OptionsTrading #IntelEarnings #UnusualOptionsActivity #TechStocks #Semiconductors #TradingView #EarningsSeason #DayTrading #CallOptions
$INTC Got Smacked. Relief Bounce or Trap?Yikes. NASDAQ:INTC just faceplanted from $23.50 straight down to $20.50. It’s peeking its head up now. If you’re playing the bounce, be nimble — this thing’s still bleeding on the higher timeframes. Don't get in unless you see more pickup and buy signal.
UltraAlgo caught the drop early. If it crosses $20 could go down deeper.

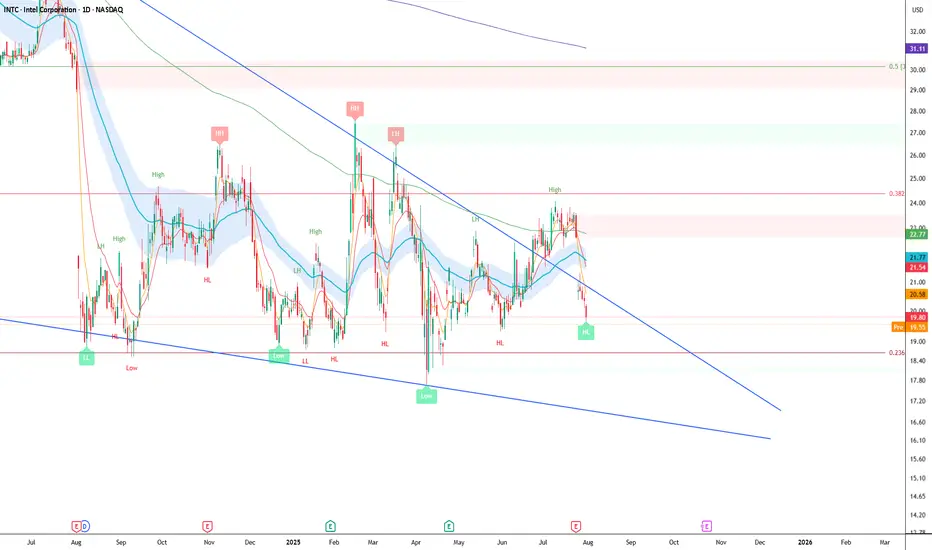
Intel Falling Wedge UpdateIntel Falling Wedge Pattern is not finished and still valid.
Failed to get above 0.382 so we could see $16-18, nice little gap to fill above the falling wedge trendline.
The pattern is valid on the weekly time scale.
Intel looks to want $13Intel looks to be waiting below $24 resistance for $13 support. I wouldn't short it at it's current price, but I would be patient and wait for $13 if you're looking to buy. Good luck!
INTC: Intel turnaround will take timeAs we have Intel earnings report released on Thursday, it miss on on EPS, but beat on revenue.
as Intel lag the industry, we still waiting some confirmations of positive turnaround, once we get it, we may get it long from this competitive level since P/B below $1.
Disclaimer: This content is NOT a financial advise, it is for educational purpose only.

Intel Failed to Get Above the 0.382When the CEO says he is cost cutting across the whole board, but discloses no plan for growth you get the pullback.
Made a LH on the weekly, but the daily still has a HL.
If it fails here, we could see $18 dollars or lower.
Falling Wedge Pattern is still valid.

Is it a time for INTEL? 32 $ will be soon.The Intel Corporation (INTC) chart on NASDAQ illustrates the stock price dynamics from 2024 to July 2025. Initially, the price rose to a peak in the first half of 2024, followed by a significant decline, reaching its lowest point around 24 USD by the end of 2024. Since then, the price has been consolidating in the 24-26 USD range, which may signal preparation for a potential rebound.
The moving averages (MA) on the chart suggest a gradual convergence of lines, indicating a possible turning point. Oscillators at the bottom of the chart, such as RSI, may indicate oversold conditions, supporting the hypothesis of an upward move. The 26 USD level acts as a strong support, and breaking above 28-30 USD could pave the way to 34 USD, a previous resistance level.
A potential rise to 34 USD is plausible if the price maintains momentum and breaks through the resistance with sufficient volume.
Potential TP: 32 USD
Bullish?Anyone have any thoughts? Im thinking 9/19 24C. Its looking primed and I just saw the short squeeze news, not that it could really mean anything, but what do yall think?

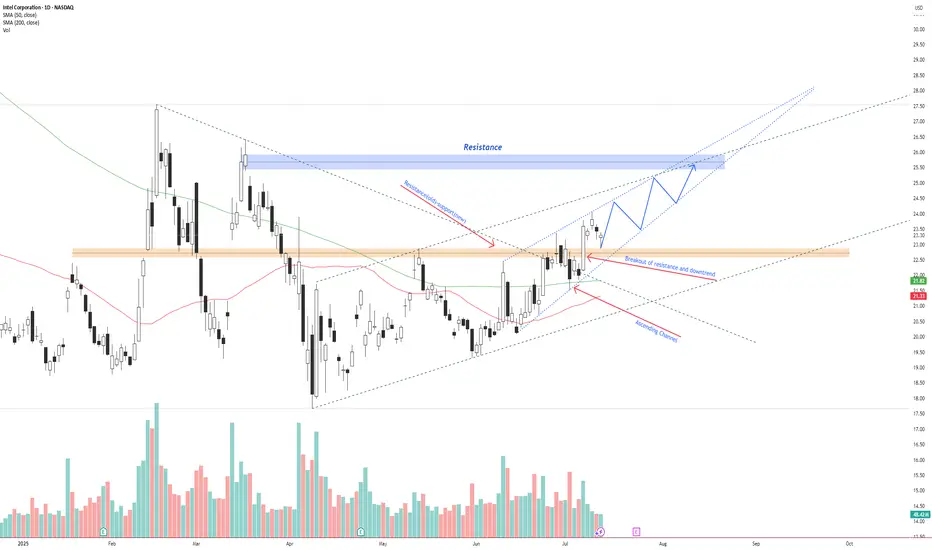
INTC – Breakout Confirmed, Bullish Continuation Inside AscendingIntel NASDAQ:INTC has broken above previous resistance and a descending trendline, confirming a bullish reversal.
Price is currently respecting an ascending channel and forming higher highs and higher lows. The breakout retest around $22.50 has held as new support.
If the current structure remains intact, price could continue toward the $26.00–$26.50 resistance zone. A breakout above this zone opens the door for a move toward $28+.
Key levels:
Support: $22.50 (previous resistance)
Resistance: $26.00–$26.50
Trend structure: Bullish channel
Volume supports the trend, and price is trading above both the 50 SMA and 200 SMA.
📌 Watching for a pullback and continuation move inside the channel.
This is not financial advice. Always do your own research.
I could be wrong.... but: Earnings breakout? Intel has certainly tested the patience of investors lately. That said, it’s in these moments — when sentiment turns and many walk away — that opportunity quietly builds. I’m maintaining my position, currently averaging around $24 per share alongside a sizable options exposure.
What makes this cycle feel different? It reminds me of Intel’s rally under Pat Gelsinger when the stock surged to $50, but this time the momentum seems more organic, driven by operational improvements and emerging tailwinds rather than speculative hype.
We’ll see how it plays out, but I’ve been meaning to put this out there: I’m still here, still holding, and watching this story unfold. Let’s go.
Intel Share Price Hits 3-Month High Without Clear CatalystIntel (INTC) Share Price Hits 3-Month High Without Clear Catalyst
Intel Corporation (INTC) stocks rose by over 7% yesterday, making them one of the top performers in the S&P 500 index (US SPX 500 mini on FXOpen). As a result, the stock price reached its highest level in three months.
What’s notable is the apparent lack of clear drivers behind the rally. According to Barron’s, the increase in INTC shares could have been triggered by a rating upgrade from Wall Street analysts or a corporate announcement – yet no such developments have occurred. "Nothing new or fundamental," says Mizuho managing director and technology specialist Jordan Klein.
At the same time, from a technical analysis perspective, the INTC price chart is showing significant developments. Examining these price movements may provide clues as to what’s fuelling the recent rise.
Technical analysis of INTC stocks
For many months, the share price had been confined within a downward channel. However, the psychological level of $20 acted as a strong support – repeated attempts by bears to push the price lower ultimately failed.
Bearish patterns in INTC’s chart may have led to a supply squeeze, as holders were given repeated reasons to sell (particularly against the backdrop of Nvidia’s success). Yet the bullish reversals near the $20 mark suggest that institutional interest was accumulating the stock at what was perceived to be a deeply discounted level – a characteristic sign of the Accumulation Phase in Wyckoff methodology.
It is this lack of available supply that could explain the sudden price rise in the absence of obvious news catalysts.
Since early summer, INTC shares have been making higher highs and higher lows, breaking upwards through the descending channel and beginning to form the early stages of a new bullish trend (highlighted in blue). Should fundamental catalysts emerge in the near term, they may serve as the spark to accelerate this nascent rally.
This article represents the opinion of the Companies operating under the FXOpen brand only. It is not to be construed as an offer, solicitation, or recommendation with respect to products and services provided by the Companies operating under the FXOpen brand, nor is it to be considered financial advice.

Intel Falling Wedge on the Weekly Time Frame.If we can hold and get above the 200 EMA on the weekly time frame then we can target the 0.382.
The main target would be the golden pocxket at 0.618.
The target is $50 located at the 0.786.

INTC wyckoff channel INTC technicals show its in a wyckoff channel with lots of accummulation over the past couple weeks-months; VPA confirms buyers are positioned already.
In case of a breakout it would look to close the gap, consolidate before continuing up.

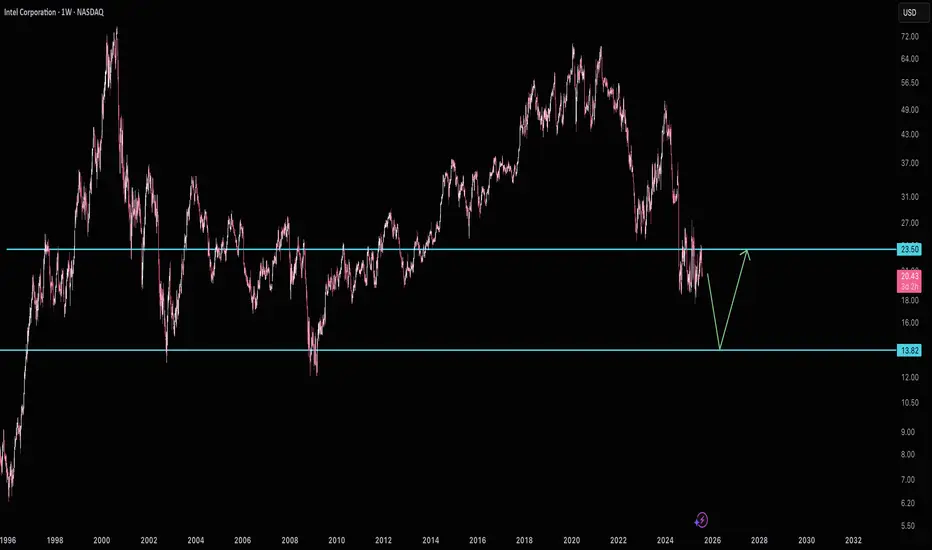
Intel - The rally starts!Intel - NASDAQ:INTC - creates a major bottom:
(click chart above to see the in depth analysis👆🏻)
For approximately a full year, Intel has not been moving anywhere. Furthermore Intel now trades at the exact same level as it was a decade ago. However price is forming a solid bottom formation at a key support level. Thus we can expect a significant move higher.
Levels to watch: $25.0
Keep your long term vision!
Philip (BasicTrading)

INTCThe INTC stock analysis on the weekly timeframe shows the formation of strong patterns and is currently within excellent demand zones, as indicated by the green area on the chart. Our target is the specified supply zone.

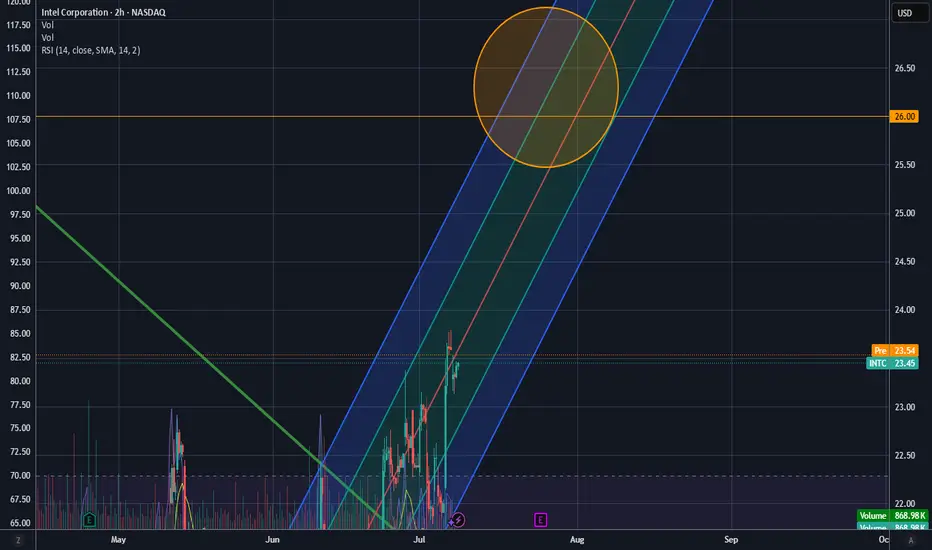
To 26$The price has been repeating the same pattern for months…
It drops to the $19 support level (blue line), then climbs back up to the $22 resistance (purple line).
When it breaks above $22, it rallies to $26 (light blue line), only to fall back to $19 after failed breakouts.
Last week, it closed above $22 and is now heading for a new test of the $26 level

INTC getting ready to start it's upward trajectoryINTC has been ranging and coiling since July of 2024. It finally, is starting to look like bullish movement is about to break upwards.
As you can see, INTC has just broken the downward trend line as well as the triangle pattern. A break and hold above $24.40 would indicate the start of a new uptrend in the chart.
Indications that the stock is gaining bullish momentum on the weekly chart:
The Williams %R is approaching and getting ready to break the 50 line.
The MACD is bullish and approaching the zero line.
The stock has bounced off of the volume shelf on the AVP 4 times and is now breaking out of technical patterns.
Money flow on market cipher B has crossed over green.
EMA's are starting to turn upward to flip bullish.
The marked move on this triangle pattern is approximately $40.
From a fundamental standpoint, Intel is trying to fix the business on two tracks at one time:
1)Near-term – ship competitive AI-centric products now (CPUs, GPUs, Gaudi accelerators) to put revenue and margins back on a growth path.
2) Long-term – reinvent itself as a contract chip-maker (Intel Foundry) so it can win outside customers and leverage its huge fab investments.
Think of it as “sell more chips today, sell more manufacturing tomorrow.”
Let's see Intel can build enough momentum to break this range for the bigger move up. The table is set from a technical standpoint.
Not financial advice. Do your own research.

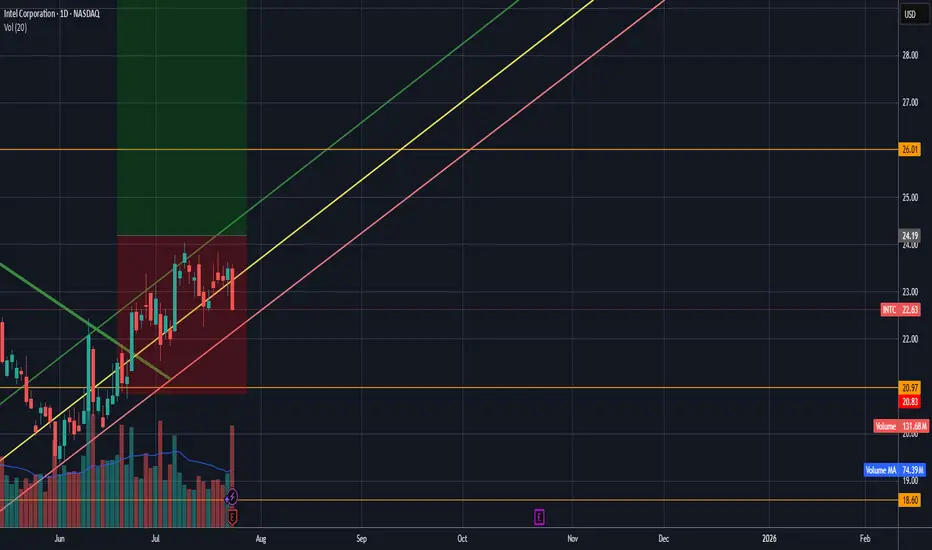
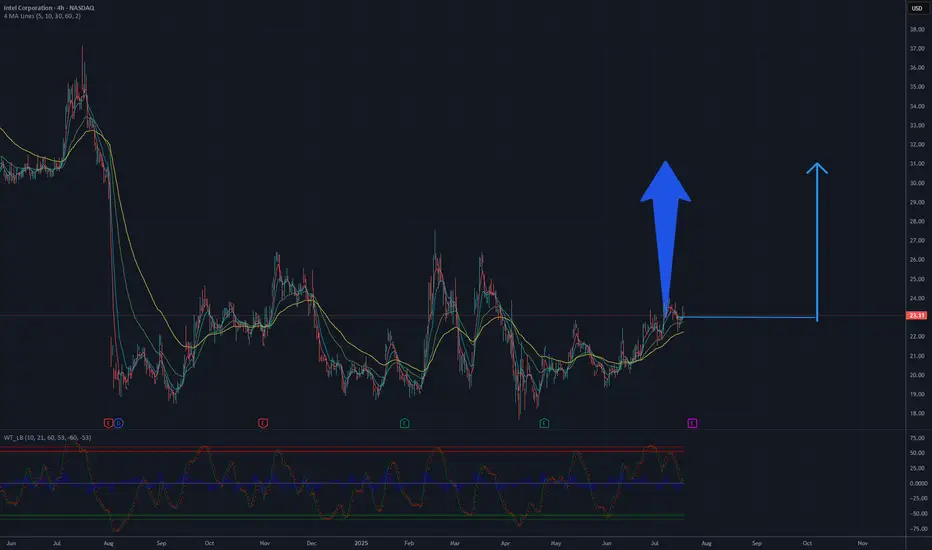
Quick View: $INTC- New box with increasing volume while EMAs are going bullish.
- Almost the same pattern on the hourly.
