Calls ideaI just bought a bunch of calls exp. on 06/16 strike 31.5. I think is going to test the $33.60 level after breaking out the channel.
INTC trade ideas


Watchlist 2023-06-07 $PACW $ZION $BABA $CVNA $INTC $LAZRAMEX:SPY failed to get under the important support at 426 early in the session PD which led to a small rally, giving it back mid day, but then finishing strong into the close and AH. PM session is showing strength trading nears the monthly highs at 430. As yesterday was a trend day to the upside, with up stock having 4X the volume as down stocks, I anticipate todays range to be slightly more muted unless we can get past the 430 resistance or the 426 support. In either of these cases, watch for the retest of the levels to get in longer term positions in that direction, and vis vera, watch for fakeouts to get into short positions in the opposite direction.
For further confirmation of a trend day, watch for:
USI:ADD pinned near +\-2000
USI:VOLD ratio over +/- 3
USI:TICK cumulating past 0 wicking to +/-900
Regional Banks - trading with elevated PD vol. if banks can get over PD high, there is room in most names to the upper end of the next range
Support Resistance Inflection
NASDAQ:PACW 8.0 8.5, 10 8.5
NASDAQ:ZION 30 31, 33 31
NYSE:FHN 11.40 11.75, 13.4
Chinese ADRs - Lower as a group to start after data overnight showed exports in May suffered a sharp drop of 7.5% compared to the previous year, vastly exceeding the minor 0.4% fall predicted by a Reuters poll. Watching for weakness off the open and joining a retracement for a short.
NYSE:BABA ,
Other Watches:
NYSE:CVNA - over 15.00 if there is a minor flush off the open that is quickly bought.
NASDAQ:INTC - over 31.50 if chips see some life back in them.
NASDAQ:LAZR - buying on dips near 7.0
Comment what you are watching!


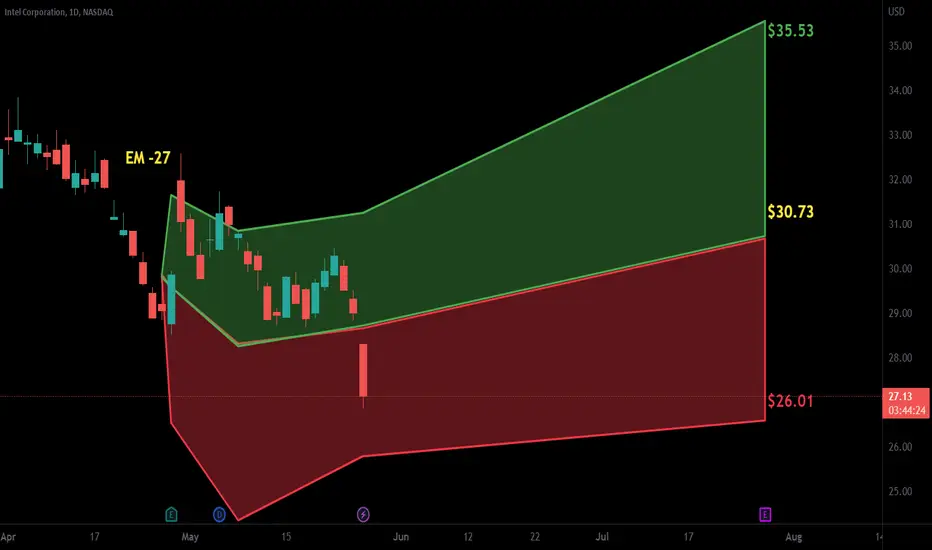
Capturing Reversal Opportunities - Dual Trade Idea for INTC StocGreetings, traders! Today, I present a dual trade idea for INTC stock that encompasses both short and long positions. Let's explore the details of each trade to maximize potential profits and manage risk effectively.
Short Trade Idea:
We begin with a short trade opportunity, entering the market at $31.31 and setting a stop loss at $32.21. Our target for this short position is set at $24.74, providing a compelling risk-reward ratio of approximately 1 to 6.57. Through careful analysis, I identify bearish momentum which signaling a potential downside move.
Long Trade Idea:
Following the completion of the short trade, we anticipate a reversal in price action and the emergence of a bullish opportunity. We aim to open long positions at $24.49, setting a stop loss at $23.81 to manage risk effectively. Our target for this long position is set at $37.58, offering an impressive risk-reward ratio of approximately 1 to 13.09. This trade idea is supported by our analysis of potential bullish catalysts and favorable technical patterns.
By combining both short and long trades, we aim to capitalize on the market's potential for price swings, positioning ourselves to profit from both downward and upward movements. This dual strategy allows us to adapt to changing market dynamics and maximize potential gains.
Please note that trading involves risks, and this trade idea is for educational purposes only. It is essential to conduct your own analysis, consider your risk tolerance, and, if needed, seek advice from qualified professionals before making any trading decisions.
TRADING as a BUSINESS wishing you success in your trading endeavors as you navigate the opportunities presented by INTC stock.

INTC, 10d+/-24.97%falling cycle -24.97% more than 10 days
==================================================================================
This data is analyzed by robots. Analyze historical trends based on The Adam Theory of Markets (20 moving averages/60 moving averages/120 moving averages/240 moving averages) and estimate the trend in the next 10 days. The white line is the robot's expected price, and the upper and lower horizontal line stop loss and stop profit prices have no financial basis. The results are for reference only.

INTEL zoomed outnot going to say much! No Brainer. all above support is money in the pocket.
With the chip A.I. times and intel have new leadership and new bright future. and NVDIA saying intel chips looked oke.
easy trade long short and midterm.
ENJOY!
Safe al!!
Stone Capone

Watchlist 2023-06-01 $SOFI $LCID $BAX $INTC $CHPT AMEX:SPY slightly higher as the debt ceiling bill passes in the House, will now move to the Senate. Garnering bipartisan support, the bill to suspend the $31.4 trillion debt ceiling was approved and is set to be delivered to the Senate. With a Monday deadline looming, the Senate is expected to pass the measure before the government exhausts its ability to pay its bills. Key Res for today is 4.19, 420.50, PD inflection and pivot high. Key support today is 417.5. 416.
For further confirmation of a trend day, watch for:
USI:ADD pinned near +\-2000
USI:VOLD ratio over +/- 3
USI:TICK cumulating past 0 wicking to +/-900
NASDAQ:SOFI - SoFi's stock surge continues as debt-ceiling deal brings 'highly positive development'. There's no question after looking at the last two days that sofi is hot right now. Particularly interested in starting a position near the 6.50 range support and also the 200 ema. If we see buying. Above this level there is plenty of room to go 7.50 and 8.00.
NASDAQ:LCID - Lucid Group's stock slides 10% premarket after EV company announces $3 billion stock offering and private placement. Short under 6.65 as long as 6.88 can confirm as resistance first. If there is no confirmation of sellers they this can be susceptible to a fakeout that rallies if it quickly reclaims 6.65
Support 6.65
Resistance 6.88
Inflection 7.00
NYSE:CVNA - over 14.00
NYSE:BAX - no news but had an impression aftermarket vol bar after trending down for the last month. 1.9 PMP vol and 3 RVOl yesterday. Looking to see if buyers decide this is the day for a trend change.
NYSE:CHPT - keeping an eye on CHPT for a second day play, preferable taking a long near support 9.25 for a swing trade, must BO form the 9.80 for confirmation.
Chips:
Profit taking PD for chips as NASDAQ:NVDA , NASDAQ:MRVL , NASDAQ:MU all heading lower. Looking for dips into key levels, and BO's from consolidations where there is at least 2 touches of a level.
Other Watches:
NYSE:AI
NASDAQ:INTC - over 32
Comment what you are watching!

INTEL !!!!!not going to say much!
With the chip A.I. times and intel have new leadership and new bright future. and NVDIA saying intel chips looked oke.
easy trade long short and midterm.
ENJOY!
Safe al!!
Stone Capone

INTC round two... 3% and Run with more upside.Looks like Intel is setting up again... will be patient with this one.
Looks like INTC does not have the strength (at this moment) to break through the downtrend.
Wait with trade when it will get back to a daily base.
If it breaks support at 28.90 get out.
If there will be a break out... 3% and Run
Entry - 29.00-29.40
PT - 30.25
SL - 28.90

$INTC , Analysing Trends, Patterns, and IndicatorsNASDAQ:INTC
Greetings, fellow traders! I am thrilled to present my analysis and insights on TradingView, where I will be sharing trend analysis, chart patterns, and technical indicators to help you navigate the exciting world of the stock market. It's important to note that I maintain a neutral stance and base my decisions solely on identifying promising opportunities.
As an observer of market trends, my goal is to provide you with comprehensive and visually appealing charts that showcase the potential opportunities I see. Please remember that I am not a financial advisor, and any investment decisions you make should be thoroughly researched and evaluated based on your own risk tolerance and financial goals.
In each analysis, I will walk you through the patterns and indicators I have identified, highlighting key support and resistance levels, trendlines, and other critical technical aspects. My approach is to objectively present the information and allow you to interpret it as you see fit. Whether you choose to go long or short in the stock market is entirely up to you.
My main focus is to share the knowledge and insights I have gained from studying charts and technical analysis. By doing so, I hope to contribute to your trading journey and help you become a more informed and confident trader. It is important to continuously learn and adapt to the ever-changing dynamics of the market.
I invite you to join me on this exciting journey as we explore the fascinating world of trading together. Feel free to provide feedback, ask questions, and share your own perspectives in the comments section. Your engagement and participation are greatly appreciated.
Remember, trading carries risks, and it is essential to conduct thorough due diligence before making any investment decisions. I am here to provide information, but the responsibility lies with each individual trader to make their own choices.
Thank you for taking the time to explore my charts. I hope you find value in the insights I share, and may they contribute to your trading success. Happy trading!
Disclaimer: I am not a financial advisor. The analysis and opinions expressed here are solely based on my observations and should not be considered as financial advice. Please consult with a licensed professional before making any investment decisions.

I am short INTC 29.67 look daily chart heading into the 50 day with no vol
We have more selling buying
and lower highs
know look weekly chart to right look stoch heading down
so that means any rally gonna fail u can see daily stoch on bottom
that why I am in small shares at first.
Target 28 that breaks then 25
stop is 30.47

$INTC with a bullish outlook following its earnings #StocksThe PEAD projected a bullish outlook for NASDAQ:INTC after a positive over reaction following its earnings release placing the stock in drift B with an expected accuracy of 57.14%.
INTC breaking symmetrical triangle target 23.91Probably due to news and fundamental issues (China, Nvdia, etc..) INTC has not finally been able to break the MA 200, breaking down a symmetric triangle with target on the support on 23.91$.

INTC 3% and RUN15/05/2023
1st PT - 3% and Run - 29.79
OPT - 31.10 - 31.80
SL - 28.45 - Move to breakeven when it will be close to 3% gain.
When 3% gain will get reached move SL to 3% gain.
3% and RUN...
CCI on -97
RSI on 43
SMI curling up signal crossover

Intel ( Bullish!)I'm Bullish on Intel.
Bollinger bands have tightened and volatility will be making it's way into the stock. This stock has been in a downtrend for almost 2 weeks now, as depicted by the trendline I've drawn. OBV has curved upwards and we have a total of 3 virgin points of control lingering above the current price. If we can break above $29.07, we should easily see $30.07. I don't want to look too far ahead, so that will be my price target for now. There's so many bearish predictions on this stock, i have no problem being the outlier. I am studying volume profile / Volume price analysis and i believe my conviction to be true. Stocks are controlled by institutions, not common investors. Always follow the big money. Trend-line break and $30.00 coming soon.

Intc shortHeaded back down to 29.00
If it breaks below 29.00 then that's a head and shoulder.
First target is 29.75 gap close

$INTC - Bump & Run Reversal PatternPerhaps even more than the Bump & Run Reversal Pattern being formed, what's sparking my attention in this market is the beautiful distribution patterns which this market registered before the downtrend which appears to be transitioning to an accumulation stage now.
Look how this market displayed an erratic price action since 2018, forming that final and chaotic base before the sell off.
Look at how it produced a RSI bearish divergence at the right end of the base, before devil cross and breakout below the base's support.
That's chart poetry. What can you learn from it?
- Get away from late stage bases.
- Do not trade breakouts formed with RSI divergences.
- Use this late pattern as a bearish trigger for the bold traders out there.
What else? Oh,, of course, the B&R reversal pattern. Can you see it as well? A bullish trade here is very difficult to execute nevertheless. Primarily because if we wait for a breakout from that trendline/10 EMA, then we will be left with a poor risk to reward ratio for this trade. So it needs a bullish trigger as close as possible to the current support area.
No matter what you do, remember that this is a game of odds, not of certainties. Therefore your number one priority at all times should be to manage risk diligently.
Cheers,
Tenacious Tribe - Quantified Trading Strategies & Studies

INTC Target ~35A bullish breakout of a Triple Bottom pattern has occurred. Price came back to retest support.
Price Target around 35

INTC - Waiting for Take Off?INTC is inside the Waiting Room for Bullish Action
Current Idea: Neutral
Important Price Point:
Current Stop Loss: $ 29.29
Lowest Support: $ 24.87
Resistance: $ 33.84
1st Price Target: $ 36.60
2nd Price Target: $ 46.54
3rd Price Target: $ 53.13
OVERALL VIEW:
Scenarios:
The Price Gap of $30.93 - $31.10 has been a fortress lasting 7 months.
A breakout occurs on W4 March 2023 until the last swing high at $33.84.
A short-term correction was stopped by Earning Reports last Thursday.
A new price gap occurs between $ 29.95 - $ 30.81.
Pay attention to the $ 29.29 - $ 29.95 area for the current best entry level.
$ 29.29 is coming from the Weekly Conversion and Base Line (Ichimoku Cloud) value which holding on as support since 20 March 2023.
Weekly Ichimoku Cloud is still in a bearish bias, but the daily has been in and out - above and below the cloud consolidating.
I believe accumulation is in progress right now.


INTC breakoutEarnings reaction was good, if it opens strong tomorrow it could break the descending trendline and be a decent swing to 35s

possible bounce off the 61.8% level.NASDAQ:INTC
I am thinking of buying the dips at low 29s, for the 37s/37s targets next
RockSpear™ for daytrade and swing entries
