My idea on where we are going --> Higher!Big picture you see an inverted H&S, then zoom in on the right shoulder you can see a smaller inverted H&S forming. If we get a cooling in the labor market and lower inflation readouts then I expect small caps to explode to the upside.
IWM trade ideas

IWM about to freakin dieThese two patterns look very similar to me. I think IWM is about to take an absolute giga dump in the bed like Depp's ex wife. watch out.

Russel 2000 ETF (IWM): cup-with-handle formingDAILY Russel 2000 ETF (IWM) cup-with-handle pattern
A break above 210.60 in June will send it flying to 232 by August 2024.
Weekly:
Weekly stage three Ichimoku crown pattern
Daily:
cup-with-handle pattern
first pb of new trend
5emas-macd pb
Ichimoku stage 3 with "FLY" bounce off cloud pattern

Small CapsA lot of speculation regarding small caps being a 'catchup trade'.
Perhaps it will play out that way.
Perhaps it wont.
A few observations:
Weekly chart has held long term trend, well, over the past 20 years.
Small caps are sensitive to Fed Funds Rates.
The circumstances of the rate change is important.
My expectation:
Small caps upward move will precede the FFR cut.
Small Caps should fade from long term trend, given 'higher for longer'.
Stock pickers would be better suited to hand select small caps with strong balance sheets, as opposed to a shelf item small cap ETF.

US Small Caps ContinuationSurprised to see IWM fairly restrained in this upward trend as long term interest rates dropped significantly on todays CPI report. Really expect to see a quick catchup over the next few days as SPY and QQQ make new highs.

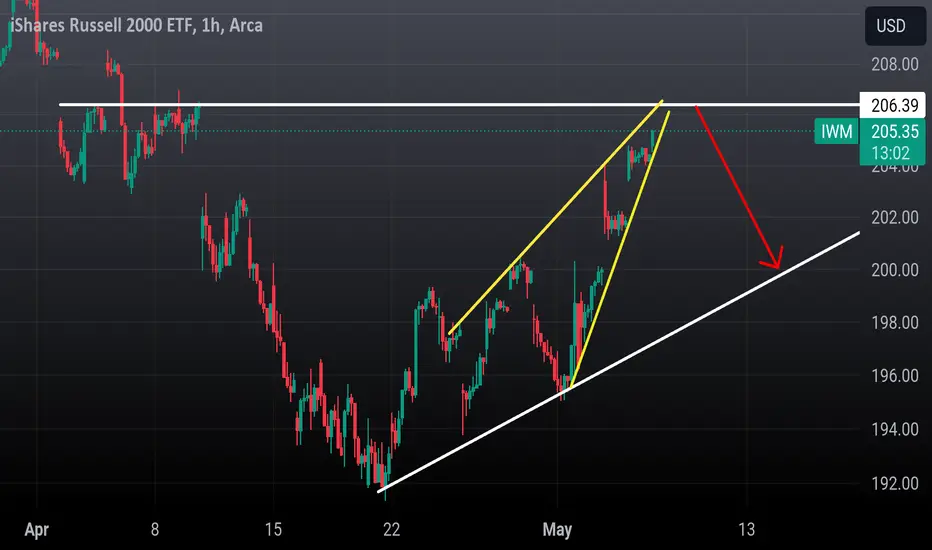
IWM Bearish at the end of a double bottom
Short target here is 200 gap close..
Has a final gap at 206.30 to close so thats where i will enter..
Stop loss 207.50
Target 200
Resistance And RSI This picture indicates that if the candlestick can stand on support level 1 at the price of 205.05, it can generate profits in the upward direction, and it can take profits at resistance level 2 at the price of 211.03. Additionally, you can check the RSI indicator to confirm the trend further; if the RSI stands above the 70 line, it indicates a bullish trend.

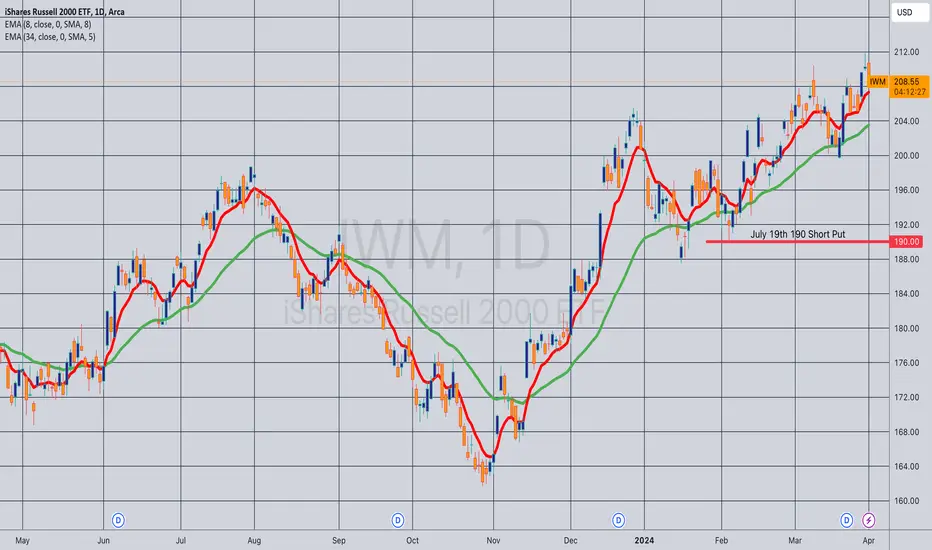
Opening (IRA): IWM July 19th 190 Short Put... for a 2.33 credit.
Comments: Targeting the shortest duration <16 delta strike paying around 1% of the strike price in credit to emulate dollar cost averaging into the broad market. (This is actually at the 18 delta, but it was either the 190 or the 185 where I wanted to pitch my tent from a delta standpoint).
Starting to slowly deploy third quarter rungs here in broad market (IWM, QQQ, SPY) while I piddle around with shorter duration higher IV sector ETF stuff.
BEAR FLAG FORMATION FOR SMALL CAPS 🐻🚩 PRICE TARGETS SETThere is bear flag formation for small caps 🐻🚩 AMEX:IWM
We have pointed FIB price targets for both the upside and downside.
We expect the retracement to go as between the range as low as $169 to $176
Will you be shorting?👀

IWMShowing good signs of strength at yearly pivot earlier this year. And then a recent bounce at the 200EMA. Not convinced this down leg is finished, therefore what we see here may be a bull trap.

Opening (IRA): IWM Sept/Oct 160/150 Short PutsComments: Going ahead and rounding out Q3 rungs here with IVR at 82.7.
September 20th 160: filled for a 1.99 credit
October 18th 150: filled for a 1.61 credit
Will look to manage shorter duration rungs as I come to them ... .

IWM target 181 ?????We now have the right shoulder of a large head n shoulder top in IWM we could now see the next move under 191 best of trades WAVETIMER stagflation anyone !!!!

Opening (IRA): IWM August 16th 170 Short Put... for a 1.78 credit.
Comments: Starting to round out my Q3 rungs here on weakness and higher IV, targeting the <16 delta strike paying around 1% of the strike price in credit to emulate dollar cost averaging into the broad market. Already have June and July rungs on, so going out to August here.

Opened (IRA): IWM June/July 182/180 Short PutsComments: Added at strikes better than what I currently have on in weakness, targeting the <16 delta strikes in the respective expiries paying around 1% of the strike price in credit to emulate dollar cost averaging into the small cap ETF.
June 21st 182: Filled for 1.89
July 19th 180: Filled for 2.22
I also briefly looked at QQQ and SPY, but couldn't get in at strikes better than what I currently have on, so am leaving those positions alone for now.

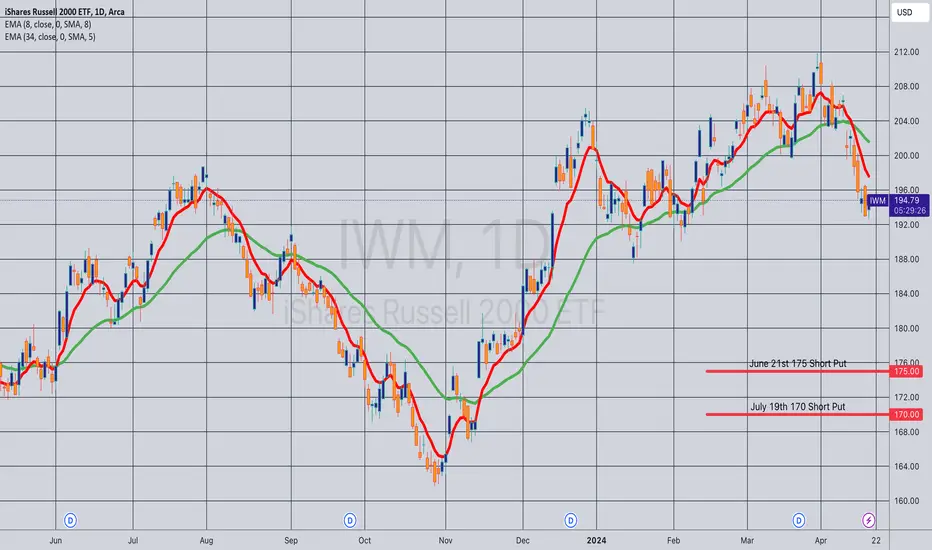
Opening (IRA): IWM June 21st 175/July 19th 170 Short PutsComments: Targeting the <16 delta strikes paying around 1% of the strike price in credit to emulate dollar cost averaging into the small caps ETF.
Adding here on weakness, better strikes than what I currently have on in those expires.
Filled the June 21st for a 1.75 credit; the July 21st 170 for 1.76.
Opening (IRA): IWM June 21st 185 Short Put... for a 1.87 credit.
Comments: Targeting the <16 delta strike in the shortest duration that pays around 1% of the strike price in credit to emulate dollar cost averaging into the broad market.
The ROC %-age isn't tremendously sexy here, so primarily doing this to keep theta on and burning while I work shorter duration, higher IV underlyings (e.g., SMH, XBI, GDX/GDXJ, etc.).


Think inside the boxLooking at weekly, IWM spent its history up thru 2020 in big, red box. Then it spent exactly one year in the upper box. Two years in the green box. And 2024 went back in the upper box. It's now at the bottom of the upper box.
The implication being that, although it has strayed outside the boxes for a few weeks at a time, it seems to have returned, and mostly stayed inside each box for an entire year.

$IWM - Can we see a relieve bounce soon?AMEX:IWM hits the first support area of $192. It is the October 2023 pivot VWAP (Volume Weighted Average Price), which has provided support before. 👀 The RSI (Relative Strength Index) is close to oversold, so we could see a bounce soon.

IWM - buy at the key supporthi Traders
IWM looks kinda bearish and we're seeing a lot of selling pressure on both on daily , weekly and monthly timeframe.
Our strategy is to play the bounce from the key support level which is shown on the chart.
If this key support level fails, most likely we will see more downside on IWM.
Entry, target and stop loss are shown on the chart.
Good luck

Long Small Caps via TNATok a small long position on small caps by buying shares of TNA. Very small position.

IWM/SPY, high probability resistance, 26.decIn 26th dec, there was a high probability weakness in IWM based on this graph.
Top of BB's and impulse has no potential, yet important resistance/break out.
//rising TNX is bad for cyclicals or small caps.

Watching for IWM to bounce off support
IWM is currently in a strong accumulation area based on the volume profile delta. The indexes were a bit oversold after yesterday's CPI report and FOMC minutes, leading to a bounce in the afternoon. I am skeptical as to whether today's PPI report and fed speakers will have the same effect so I closed my puts. Here is my reasoning:
VIX keeps rejecting above $16.25. If it does not move up sharply at market open, I expect it to reject again and move back down towards $13.00.
The 10y bonds chart looks like yields have topped out for the week after hitting the R3 fib pivot point. I see it retracing down the channel until next week.
Same situation with the Dollar.
I expect a small rally into the weekend or early next week. Timing will depend on the reaction to today's PPI report. I'd like to see a dip in the morning so I can minimize risk in case there is not enough momentum to get to $206. I expect some choppiness there so we can either continue moving up next week or head for new lows.
Also thinking this looks like another bullish wedge on NYSE..
