IWM Range ResistancePrice Action Recap:
IWM has been ranging between 162.68 and 202.01 since April 2021. That's over 2 year of sideways price movement. The question now is, could small caps finally break above this range with the FED looking to begin cutting rates mid to late 2024?
Currently, IWM has gapped up right into the major range resistance and is showing yet another rejection at this range's highs. Today's candle is also creating a possible liquidity sweep of these highs.
With that being said, price still remains in an uptrend. I personally believe IWM breaks above this level, but first I am looking for price to fill the gap below to 193.64 then make a nice retracement down to support at 188.09 - 189.24 then bounce from there in confluence with holding the long term uptrend support that price is currently holding above. If price somehow breaks below this level while also break below the long term uptrend support, that could signal a full on reversal that could possibly lead to price making a move back to the lows of the range.
Current Confluences for short signals:
- RSI & MACD massively Overbought (Waiting for a bearish divergence to confirm pullback)
- Supply Signal on the Jeanius Indicator (Only One Signal. Waiting for a Confluence sell signal)
-Decreasing Volume
- (Waiting for MACD to begin curling to the downside)
IWM trade ideas

Beautiful BreakoutSame song, second verse.
IWM flags are on fire.
Let's see some consolidation again at 200.

Opening (IRA): IWM April 19th 165 Short Put... for a 2.10 credit.
Comments: Starting to erect rungs in the second quarter (April, May, June). QQQ doesn't have an April yet, and I already have a SPY rung on out in that contract, so just doing the small caps here. Targeting the <16 delta strike paying around 1% of the strike price in credit.
I'll naturally look to add in shorter duration should we get a bump in IV, but may have to dabble outside the broad market (IWM, QQQ, SPY) box to get paid something decent in shorter duration.

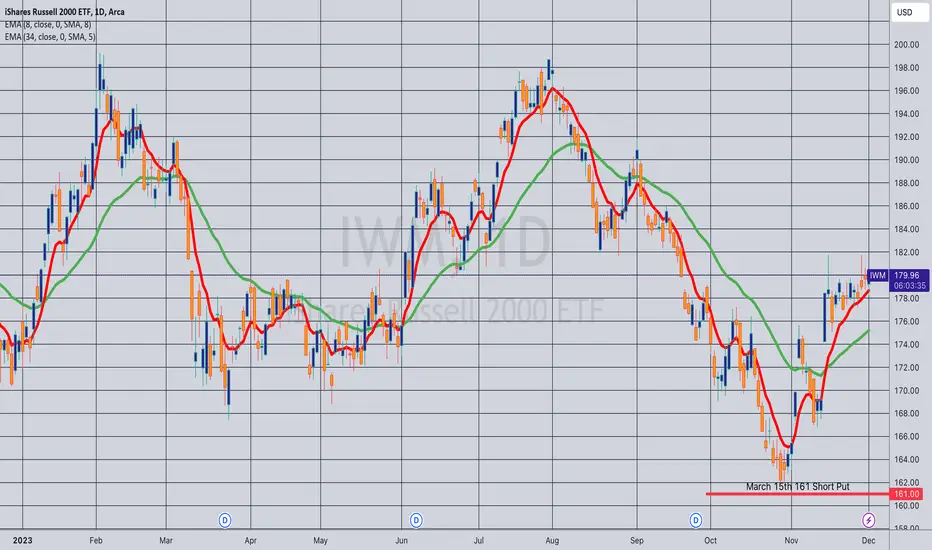
Opening (IRA): IWM March 15th 161 Short Put... for a 1.66 credit.
Comments: Targeting the shortest duration <16 delta strike paying around 1% of the strike price in credit to emulate dollar cost averaging into the broad market. I'll naturally look to add rungs in shorter duration if we get a sell-off/pop in IV.
IWM - capture the next uptrend !!!IWM setting up - might be useful to keep this idea in mind for the next few months - buy right and sit tight!!!

Russel 2000 direction for 2024 in few days!Russell 2000 has reached a critical juncture, with the IWM (iShares Russell 2000 ETF) at a crossroads for an extended period. There are two distinct possibilities, and one of them may materialize soon.
From a bullish perspective, Russell 2000 is forming a prolonged pattern, potentially breaking into a powerful bullish formation known as a high base. A crucial aspect is its consolidation below the BigRed, or the 200-day Moving Average (MA), and a resistance zone that persisted throughout 2023 and part of 2022. If it successfully breaches these three resistance levels, there's a strong likelihood that Russell 2000 will experience a rapid ascent towards the falling upper trend line, approximately around 190, represented by the blue dotted line. Breaking through this resistance could signal the start of an extended bull market for small caps.
On the flip side, if it fails to break through and the resistance proves formidable, the consequences could be dire for IWM and the broader market, with the possibility of no Santa rally or any significant upward movement in 2024.
Analyzing the volume, the lower trading activity during the high base formation suggests a lack of sellers, supporting a bullish outlook. Additionally, neither the Relative Strength Index (RSI) nor the Moving Average Convergence Divergence (MACD) indicators are signaling overbought conditions, leaving ample room for a potential bullish run.
In conclusion, given that 30% of Russell 2000 comprises small regional banks, which often drive this ETF, the upcoming PCE data could be a make-or-break situation. Exercise caution when trading small caps, as movements can be swift and in either direction.

IWM: Time to Think Small - 80% hit rate on this seasonal playI am publishing a seasonal opportunity for a ~2 month trade with several small caps. A of the details are listed together on my substack.
open.substack.com
AMEX:IWM has shown a strong rebound from the October lows, breaking out of a descending wedge on November 3rd, retesting on November 9th, and consistently moving upward since. It is currently testing the volume weighted average price anchored to the 2021 high. This is likely to offer some resistance before we see a move higher.
This trend sets the stage for a reliable seasonal pattern where small caps typically outperform larger companies. The most predictable period of outperformance occurs from mid-December to mid-February, ending higher in 24 out of 30 instances (80%) with an average return of 11.9% and a median return of 5.6%. Annually, this translates to an average return exceeding 70% and a median return over 30%.
Examining the past 30 years, we observe the Russell 2000:
Consistently outperforming the Russell 1000 in terms of both average and median returns in nearly all years.
Outperforming the S&P 500 on average in all years and higher average increases in all years, but showing median underperformance in the past decade.
Generally underperforming the Nasdaq across the time series.
I'm expecting to see IWM come back to 175-178 area before making a move higher.

IWM ratio charts revisitedI talk about IWM and SPY in this video and why I think an excellent short opportunity on IWM is coming quite soon. Good luck!

IWM breaking down?A dash for trash has been observed!
Many participants are tryging to buy to and squeeze companies that have been beaten down and fundamentally weak.

Russell 2000 ETF (IWM) ~ December 4H SwingAMEX:IWM chart analysis/mapping.
IWM ETF rally off late October lows on market expectations of the end to Fed rate hikes.
Trading scenarios:
Continuation rally #1 = multiple gap fill / 38.2% Fib / upper range of parallel channel (green) confluence zone.
Shallow pullback #1 = 23.6% Fib / horizontal line (light blue dashed) confluence zone.
Deeper pullback #1 = lower range of parallel channel (green) / 200MA confluence zone.
Capitulation #1 = re-test ~163 bottom.

IWM: Small Caps Continue the Rally, Eyeing $198Small caps have sprung back to life. The iShares Russell 2000 ETF (IWM) fell nearly 20% from its July 31 recovery high to a multi-year low in October of $162, undercutting the June 2020 mark of $164. Today, the move back up to $186 might feel like too much, too fast, but I see things otherwise.
Notice in the chart that IWM actually went through a more than two-week stretch of trendless price action. Technicians like to see such periods of consolidation within uptrends as healthy signs of rest and recovery, often setting the stage for the next leg higher. That’s about what took place.
Printing above $186 this morning in the premarket, outperforming the S&P 500 and Nasdaq 100 futures which are in the red, the little guys of the market are once again spreading some pre-holiday cheer. The move comes under the radar, too, considering that the focus among traders is primarily on bitcoin and gold. I also find it encouraging that IWM is up despite a bout of selling pressure in the bond market today, pushing the 10-year Treasury yield up a few basis points.
I’ll be watching to see if IWM manages to retest the July highs at $198, up to the $202 area – a long-term resistance range dating back to Q3 2022.

$IWM: 180 Noteably StrongWe show cased an hourly trade here that took longer than expected to play out. This is a post showcasing the potential for IWM to keep moving but still looking for the long positions to continue to be a hold. I believe rate expectations might give bulls a bit of something to chew on. Growth sectors like KRE, ARKK and XRT are looking good as well...

There is an Option 4 this out there but what is it Loving this setup in $IWM. if you look closely the end of 2018 and the end of 2021 are lining up very similar. If you believe 2024 will see some rotation to small cap stocks whats the option play here?

SHORT RUT Russell 2000 small capsFolks are getting all hot under the collar and bulled up on stonks after recent mindless rally on stupidity of lower rates in early 2024 and lower inflation.
Folks I hate to break it to you but we are in the early innings of a generational bull market for inflation and yields. Buying stonks at these egregious valuations is a recipe for disaster.
I added to long term shorts on RUT at 1830 today expecting at least 10% or more downside from here and maybe a lot more in coming months.
Oh and by the way, the RUT is now FLAT over the last 3 years since Nov 2020. How do you like that bull market eh, especially when you could have been in cash earning a nice yield risk free!

IWM Chart is Fried Turkey HotSeasonal trend rhyming like Dr. Seuss
Historical smallcap strength thru mid-Feb
Pennant pattern consolidating below $180 level
20dma > 50dma
$180 is key support/resistance level in 2023
$184 then $192 next resistance levels
Reassess/cut position below $175 support

Breakout on the daily on IWM.Thank you for watching and I hope you learn something on my analysis of $AMEX:IWM. In this video, I explain why I think we have a bullish breakout swing trade opportunity within the next few days. Have a blessed week and God bless you!


$IWMIWM has set a new zone on the 1wk chart. It looks like it is in the end of an accumulation phase.

IWM has now ended the 1st ABC up decline now in waveB The chart posted is the IWM Russell 2000 tracking etf . As the forecast called for an ABC rally back to just above 181 we should now see a 3 wave decline to about 171/165 focus on 167 area over the next 2 weeks and then rally in a 5 wave structure from that low about dec 4 to the 10 th low into a peak at .618 at the 185.7 to 187.10 area about dec 24th to dec 29th Before the next very clear leg down in the BEAR market The market could holdup to jan 10 to the 17th some what but after that the data get very very neg in the Business cycle

#IWM US Small caps at Significant levelThe US Small cap equities index - IWM - Russel 2000, has approached a massive level of polarity. This 160 level is where the old resistance has turned into support previously. Monitor for reversal and continuation upwards. A break of this level however could really cause massive technical damage. The bulls have their work cut out for them this week


IWM Long (2023.11.15) Current price : 178.46IWM Long (2023.11.15) Current price : 178.46
It shows that technical indicators are very overheated
It is worth aiming for a profit of at least 1%

IWM - Falling Trend Channel [MID-TERM]💡 Pattern: Falling Wedge
💡 RSI: 56 Neutral
💡 Risk: Low
✅ Resistance: 188
✅ Support: 170
PERFORMANCE
🟢 ST: POSITIVE
🟡 MT: HOLD
🟢 LT: POSITIVE
*ST: Short-term | MT: Mid-term | LT: Long-term
Verify it first and believe later.
WavePoint ❤️
