I'm still fascinated by the small cap crashI continue to be fascinated by the fact that small caps once retraced their entire post-Covid move. What I mean is, the Russell 2000, which is 2,000 companies that are identified as small cap stocks, had such a terrible year in 2022 that they went BELOW were they were before Covid was ever a thing.
But why is this interesting?
Because roughly $5 trillion was spent to stimulate the economy in various ways after the first Covid panic occurred.
So let's quickly think about that: the Russell 2000 was, at one point lower last year than it was before an extra $5 trillion hit the economy.
I continue to wonder what this means: did the market overreact? Is it stagflation? Did the recent rise in interest rates suck that $5 trillion back up? The money supply is shrinking again?
There are tons of questions to consider and I also think it's important to wonder if this is still not the end. The following assets have still not yet retraced their covid highs:
• Tech stocks and the Nasdaq 100
• The S&P 500
• The Housing Market
• Inflation
• Price of food
• Price of average goods
Keep in mind, several other assets have retraced and crashed quite hard including:
• Vehicle sales and car prices
• Crypto market
• Treasuries/bonds
So the question remains: is there more carnage ahead or will the market stabilize from here?
The Fed does seem to be on a mission to crash food prices, inflation, and by extensions soaring housing. So one must wonder if the policy toward that eventually makes its way back into markets, including the S&P 500 and Nasdaq-100, or if indeed the worst is over and now we are plateauing.
Part of me thinks its possible the Fed will get inflation under control while also preserving some of the market gains in tech, S&P 500, and more.
Time will tell.
So much more to think about.
IWM trade ideas

IWM: Week of Jan 17Taking a break as planned from SPY but thought I would share my thoughts on IWM. But in full disclosure some referencing of SPY will happen.
Additionally, I have ran the probabilities on all of my stocks except BA, and they are all pretty underwhelming. So let's get into it:
Next week:
Probability is mixed. As you can see from the chart, we have 1:3 for the bull range and 1:3 for the bear range.
What does this mean? Generally, this kind of mixed probability means a sentiment shift mid week.
Looking at the economic calendar for next week, we do have some catalysts, most notably jobless claims on Thursday, so that is where I would be looking for a potential sentiment shift if it were to occur.
Looking deeper into the probability, there is a slight preference for bullishness, but nothing overly substantial that I would feel comfortable swinging to.
We also have a short trading week next week which is something to keep in mind.
Price Targets:
Weekly price targets for IWM are as follows:
Bull
1. 188.31
2. 190.44
3. 192.57
Bear:
1. 185.37
2. 182.82
3. 180.27
Reference Target
Immediate reference target is shown in purple and rests at 186.89.
Opening below, I would be bullish, opening above, I would be bearish (until the target is taken out).
Tuesday Outlook:
There is definitely a notable bearish bias showing up in the probability for Tuesday. What is interesting is that, the prospective targets seem to favour a move to 185.63. But the intra-day (Real time) targets have a slight bullish bias.
This leads me to speculate that dip buying will continue into Tuesday, with a potential gap down leading to dip buyers stepping in as the market opens. However, again, the probabilities do favour, overall, more of a bearish bias on Tuesday, so its important to exercise caution if you plan to day trade this index.
Overall Analysis:
When the stock has these kinds of odds, in order to gain more insight into the likely trajectory, I apply a test that is applied in law, called the "Totality of the Circumstances" test. This simply means I look at all the facts and all of the data I have available to me and develop the most logical and simple thesis that attempts to explain the data in logical and actionable trading plans.
Based on this type of qualitative analysis, the thesis I would adopt leading into next week would be:
Overall bullish bias to start of the week with a notable pullback leading into Tuesday. This is supported by the overall need of pullback (IWM gained over 5% on the weekly and is running pretty hot on its overboughtness) and the fact that the intra-day probabilitie support bearishness on IWM with a move to the 185 range.
We can expect the stock to move towards the upper bullish range. This is supported by the slight bullish bias noted in the quantitative data on the weekly.
However, we can expect the market to react to a catalyst and change direction mid-week. Whether that be SPY hitting its overhead, year long trendline in the 400s, or whether that be jobs data or another economic catalyst. This is supported by the overall probabilities having identical support for bullish and bearish targets. It is possible we come crashing down to the bear targets (if we start with a bullish sentiment) or go parabolic up to the bull targets (if we start with a bearish sentiment). However, it is also possible, and supported with the probabilities, that we remain range bound without actually making or piercing into the bullish or bearish range. If the catalyst is not strong enough to sway the market in either direction, we could very well see a market that remains range bound and undecided.
One thing is likely though. That is that IWM is going to experience some selling. How do I know? Because IWM has exceeded its monthly range:
While IWM will drop from its range and sustain this, it generally will not sustain a bullish exceedance of its range this early on in the month:
It doesn't usually sustained this kind of selling either this early in the month:
It generally waits to later in the month before it does any type of more aggressive move out of its range. So judging by current timelines, we should see this sell back into the range at some point.
My plan:
How I manage weeks like this is by limiting my trades to day trades and, if taking a swing position, limiting it to small positions.
I would be inclined to swing short if we see IWM make it to that green box and SPY reject from its overhead resistance.
I would be inclined to buy dips on Tuesday.
We will have to see where the 99% targets fall. RTY, YM1! and ES1! have already taken out their weekly 99% targets this evening. So we will need to reference the 99% on SPY, DIA and IWM on Tuesday. These can give us a clue into the overall direction of the stock for the week.
As always, I will update to this post as an addendum as information and data become available to me.
Leave your questions and comments below and trade safe everyone!

$IWM Russell 2000 Ishares ETF- 15 minGot a nice hammer candle that tested 50 day MA before bouncing back up to the upside after opening bell sell off. Holding 21 day EMA as support with 50 day as secondary. Hourly chart also holding MAs as support trendlines. LONG IDEA

Is IWM running with the bulls ?IWM smart money been creeping into the small caps for some time now while most of the market running after TSLA the IWM been setting up for this big break out move to the up side

IWM Tripple TopYesterday, whales positioned themselves for a potential triple top on IWM.
Resistance zone ranges from 188 to 190.

I wouldn't be that shortHere is another view of the small caps index. I posted previously a big drop (see my related ideas lines below) however there is this uptrend that need to be broken to finally say that we are in a bear market. At this moment the market is still deciding where to go. I personally prefer to buy stocks with great potential to the upside instead of shorting. I made more money buying and hold that shorting.

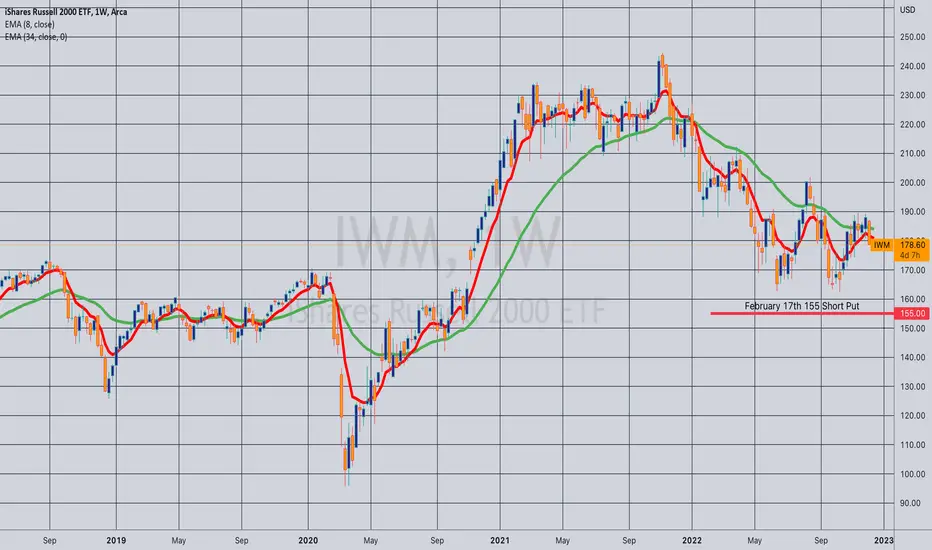
Opening (IRA): IWM Jan/Feb/March 169/160/155 Short PutComments: Laddering out here on weakness ... .
January 20th 169: 1.75 credit.
February 17th 160: 1.68 credit.
March 17th 155: 1.89 credit.
The weakness isn't "ideal" here, but I am relatively flat, so need to get theta out there and grinding. Will look to add at intervals over time.

$IWM Daily Chart GOLDEN CROSSPotential Golden Cross incoming which can provide some drastic movement to the upside. Golden Cross is when 50 day (blue) MA crosses over 200 day MA (orange) for any new traders. Higher probability when using higher time frames like the daily, weekly or monthly chart. The higher the time frame, the stronger the signal IMO

$IWM DAILY CHARTDouble bottom on the daily chart. Recent cross over the 200 day MA, potential reversal. Cup & Handle forming. MACD Crossover. Small caps took the worst beating in 2022. 2023 rebound?

Small-caps in troublePrice may test the broken support of the double top. I just bought some puts anyway expiring in February, strike price $180.


Opening (IRA): IWM Feb/March 156/150 Short Put LadderComments: Added rungs in IWM on weakness, targeting the <16 delta strike in the shortest duration paying around 1% of the strike price in credit.
I'm doing things a little differently than last year, where I basically sold the 45 DTE weeklies (assuming they were paying around 1% of the strike price in credit), but constantly had a lot of idle buying power, which is not the "maximal deployment" I was really shooting for, so am fiddling with doing things this way instead. Doing only two rungs here, since the <16 delta strike in January isn't paying 1%, and there isn't an April yet.
February 17th 156 Short Put: 1.66 credit
March 17th 150 Short Put: 1.77 credit

Opening (IRA): IWM Feb/March 154/145 Short Put LadderComments: Squeezing in rungs where I can, targeting the <16 delta strike paying around 1% of the strike price in credit.
February 17th 154: 1.61 credit
March 17th 145: 1.45 credit

IWM Rock and a hard place Closed up right at trendline resistance (Former support). Also closed right below Daily 21ema.
If we break over 175, My bullish targets is 200sma at 180..
A rejection at 174 and we retest 170, if 170 goes, we retest Oct lows

RUT equilibrium Rut looks nicely balanced
It has retraced time and price in a controlled and balanced manner and is now in a clear range
All moves look balanced over the last few years
There is no evidence of a bear market in small caps at present…
GRI 2023

IWM 30m Hagopian GapAMEX:IWM
Hagopian's Law: When price reverses before reaching the Median Line or MLH (parallel), or extension; you can expect that the reversal will be larger than the preceding move towards the Median Line.
AKA price will exit the fork.
Short IWM , target the trigger line.
Fat_Fat

IWM $164P 1/20/23We had a double top $189 and a hard rejection I noticed that greed was really heavy around that area. Then we broke and retested the $176 area. Seeing how we've got a ton of 200 MA's above us, I would enter here and if we come back to $176, average into the position. I've had numerous bearish signals over the last month and I'm pretty confident about this position. I set my TP at $164 because, last time we were at those levels we had a lot of fear in the market. Also on June 15th 2022 and October 12th 2020 we saw violent reactions to this level. I'd rather claim my gains than to fight support.
Follow me to keep up with my calls I'll try to make sure post at least once per week.
Leave a comment if you have a specific ticker you'd like me to analyze. AMEX:IWM

IWM/SHY Smalls Caps divided by short term bondsThis chart has timed the market rallies and resistances with impeccable accuracy since the top was put in November of 2021. It is foundational to my daily trend review process. The ratio has been on a weekly sell signal and trend without any technical reversals. Consider ratio charts as hard data and much more reliable than financial pundits who say the "bottom is in" every time we hit a new low then bounce for 2-3 months.

IWM LOTTO PLAY > Call Vertical Spread
Taking a small Long here with Vertical Spread , playing for this bounce FOMC Trade .

Opening (IRA): IWM February 17th 155 Short Put... for a 1.62 credit.
Comments: Squeezing in some rungs where I can, targeting the <16 delta strike in the shortest duration paying around 1% of the strike price in credit.
IWM SHORTHello guys, I share my next trade idea, the price has made a double ceiling at the price of 188.00, at this moment it has broken the green trend line and has broken the base of the double ceiling, we will seek to enter short, looking for the projection according to the distance from the base to the tip of both roofs.

Russel 2000 Bear Market?It seems by all indications that we are heading into a bear market. With raising interest rates, tapering, and shrinking of balance sheets, we will see the Russel take at least a 20% tumble from the current price. The 100MA puts the Russel 2000 at around 1400, and further down on 200MA. A couple of key points:
Only 40% of Russel 2000 are above 50-Day MA.
Only 45% of Russel 2000 are above 50-Day MA.
MACD is crossed and looks bearish.
Fed slowing down its QE.
I was a bit curious why the Russel 2000 took a dip in 2018-2019 with the economy doing so well then. The one thing that I could overlay to make some sense to it was the Federal Funds Rate went up to 2.42%
Even mainstream investors like Jon Najarian has taken short positions in the IWM for February. The economics speak it, the Fed speaks it, the indicators speak it, and now even mainstream economists are accepting there is some market shaking coming.

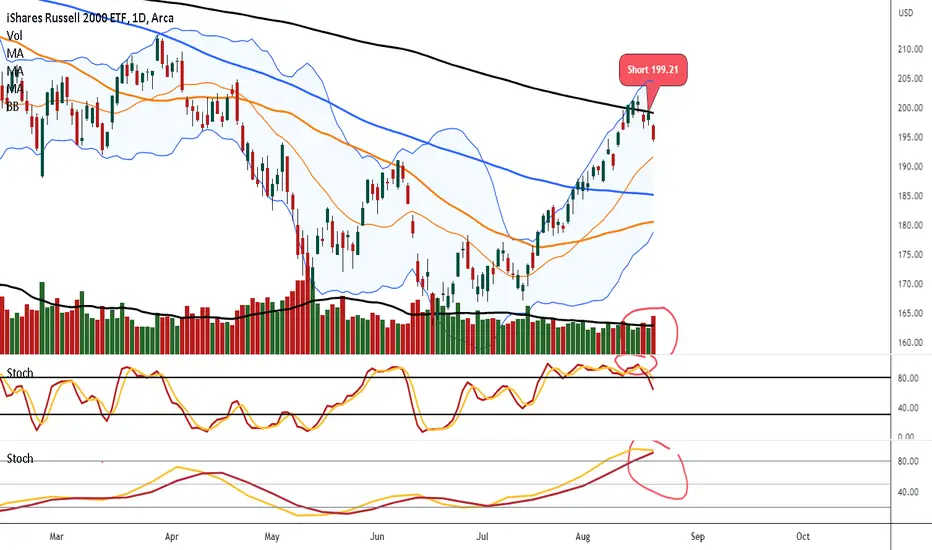
Short IWM 199.21 into that 200 day MAlook daily stoch rolling over. Look how we hit 200 day and stopped and broke down thru 100 day BEARISH.
look vol selling not bad.
look weekly stoch start roll over in time almost their.
I believe this is the next leg down to test lows and break them.
Long term short.
look over all pattern still down.
these bear market rally can be brutal only to fake u out and reverse
many think bottoms in I don't think so charts so lower