Closing: IWM April 1st 194C/200P Short Strangle... for a 16.57 debit.
Comments: This started out as a 200 short straddle that I inverted slightly. Collected a total of 19.32 in credits, so closing out here results in a realized gain of 19.32 - 16.67 = 2.65 ($265). Still have the April 8th 194C/201P inverted on (which also started out as a 201 short straddle).
IWM trade ideas

Rolling (IRA): IWM March 25th 178 Short Put to April 29th 170... for a 1.27 credit.
Comments: The March 25th 178's at >50% max, so rolling out to the <16 delta strike paying at least 1% of the strike price in credit. Total credits collected of 4.36 (See Post Below) plus 1.27 or 5.63 relative to what the April 29th 170 is paying (currently 1.96), so I've realized gains of about 3.67 ($367) so far.

IWM 175/170 Put Credit Spread - Apr 8thPut Credit Spread
Strikes: 175 short / 170 long
Credit received: 0.54
Max loss = 5.00-0.54 = $446
It has been a while since I posted and this is for a couple of reasons.
1. A short vacation away to kick back and relax
2. The markets have been chopping all over my currently open positions and taking longer to turn and burn trades, meaning there just was not much to do as I was very close to my % capital deployed limits.
This trade is simple simple. I closed out my IWM 185/180 yesterday with the pop, so today I put on a 175/170 even further out. I could sit here and tell you how I think the market is going to go roaring back up due to X Y and Z, but the reality is I have no clue. I am simply identifying areas outside of the current range, that provide a decent margin of error and decent compensation. Then I manage the trade as needed and make sure to follow my rules of -200% SL and 50% TP.
I think this needs to be said because as traders we are looked to for the answers but often we are just being mechanical. Would I like to be in a trend here where I could feel very confident about putting on a bullish trade? For sure, but that is not the case. And if we want to make money, we need to be in the game. This doesn't mean that I am not going to scale back position size and tighten other parameters such as delta etc.
What do you do in times of uncertainty, I am curious to hear - leave it below!

IWMOnce you see this h&s, it cannot be unseen. The more traders I see trying to call a bottom in the markets, the more confident I am that this resolves to the downside. Starter position into April 14 $165P's today.

IWM 185/180 March 16 Put Credit SpreadTrade Credit: $0.55 = 11% Return on Margin
Max Loss = 500 - 55 = $445
Strikes - Short 185 / Long 180
This morning I realized that I need to get more capital deployed based off of my trading plan (something I hope everyone has!) As such I went looking for trades, and today is not a bad day to enter trades.
Reasoning is below!
1. Recent red days = Increased IV and increased Put prices (although this is slight reduced due to a large green morning)
2. Still bumping around in the trading range outlined by the white support and resistance lines
3. Todays green move up is above the prior two days candles move, and is the beginning of a confirmation of a possible move to the top of the range. If we are headed there, this trade will hit its take profit much earlier than expiration.
I always try and keep these trades less than 30 DTE for 2 reasons:
1. it makes calculating expected return per month easier
2. Decay really ramps up after <45DTE and this just grows faster and faster. Ideally these trades are closed prior to <21DTE though as this is when other greeks can begin to bite you such as gamma.
Questions. Comments? Put em below!

IWM swing puts between 200-202Here on this daily chart price is at the 20sma again in this sideways consolidation. RSI has not broken above 50 and stochastic looks like it might turn down soon. On the weekly chart price has been waiting for 10ema to catch up and then it may fall again.
201.75-202 is my ideal range to buy puts based on 30min chart. I started a position with price around 200.50 and will add more if target buy zone is reached.

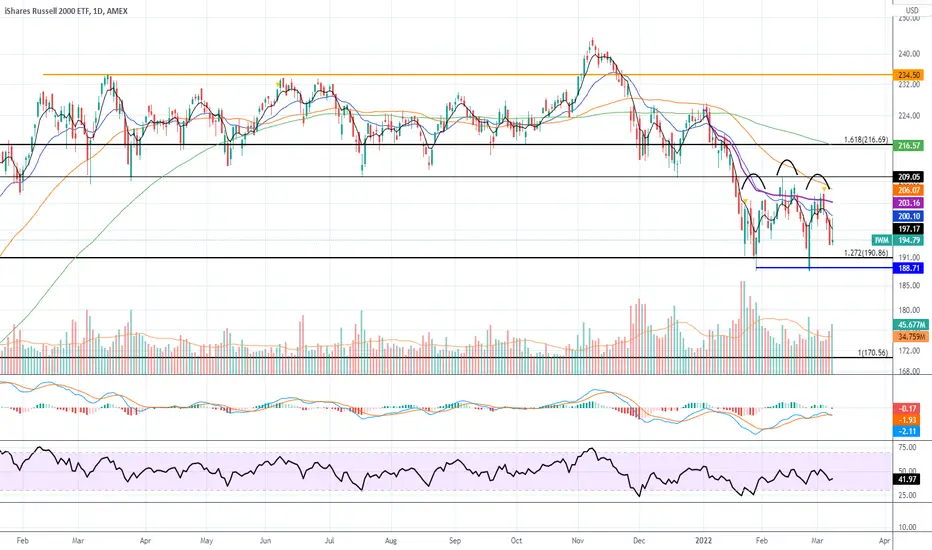
IWMBeautiful setup. Head & shoulders forming, in a downtrend, after a false breakout. Below $188 probably sees the pre-c0vid high of $170.
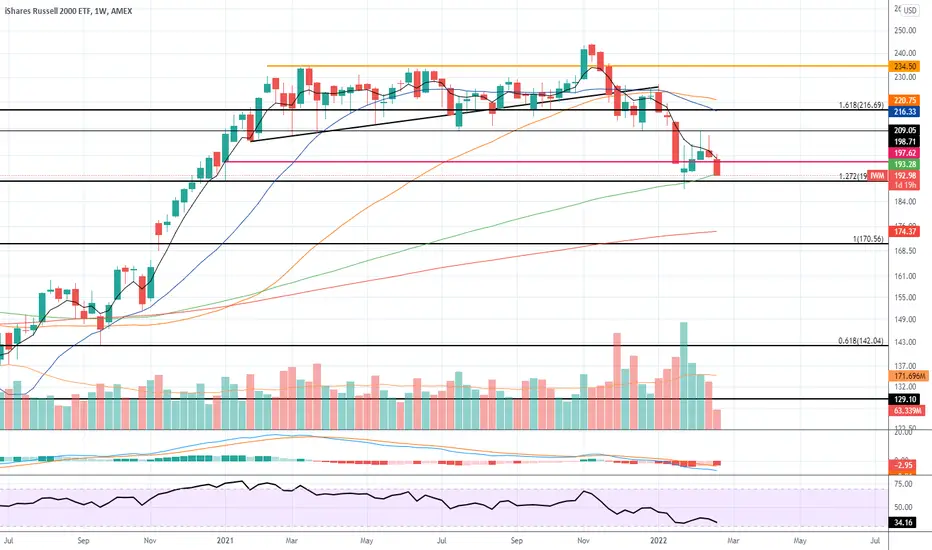
$IWM HOLD or SELLGiven the current economic situtation, and having broken the last support, this ETF is expected to fall to around 168 USD (where pre-COVID resistance was). Since november 2020 it surepassed with great lenght this price level.
FIB 0.618 seems to act as the new support level for the last couple of weeks.
It's safe(ish?) to assume the downturn is limited to the levels we are in now.
AMEX:IWM

Rolling: IWM April 1st 201 Short Straddle to April 8th... for a 1.16 credit.
Comments: Taking a little profit (1.40/$140) by rolling here. Total credits collected of 16.30 relative to a short straddle price for the April 1st 201 of 15.82.

Rolling (IRA): IWM March 18th 181 Short Put to April 22nd 165... for a .69 credit.
Comments: This isn't quite at 50% max, but only has 11 days to go, is in profit, and is the highest strike I've got hanging out there in IWM. I've collected a total of 3.83 (See Post Below) + the .69 here for a total of 4.52 relative to a current price for the April 22nd 165 of 1.80, so have realized gains of 2.72 ($272) in this puppy so far.

$IWM trading it 3/7over 201 202.5-204 possible
under 197 194-195.5 possible
#intradayoptionstrading #daytrading
NO bias, plan for red or green day. chop/ranging = hand sitting

Indexes Weekly Review 2/28/2022Last week ended with a lack of conviction from all the indexes. SPY, QQQ, and IWM failed to close above their resistance line or the low set on the week of Jan 24. Looking at the intra week action, we see that none of the indexes could last a day over their resistance line. IWM found resistance at the 2% filter off the channel and 40 day EMA. SPY found resistance at the 20 and 200 days EMA. QQQ found resistance at the 20 days EMA.
Looking at the week ahead, we will get greater clarity if the downtrend will continue, preferably by recording a close below the low of the week of Jan 24th. There also could be a sign of a downtrend reversal by all three indexes closing multiple days above their resistance EMAs and resistance line.

$IWM Key Levels, Analysis & Targets$IWM Key Levels, Analysis & Targets
My targets for the next swing.
Target 1- 184.57
Target 2 - 159.26
Support around 142 (not labeled today)
Let’s see what the IV is at the time when it hits to determine sell targets.
GL & happy swinging…
-----
—
On the far right of the chart is my Average (Grey) Current Target (Green), and Next Level to add (Red) Percentage to target is from my average.
ONLY ADD at support levels & FIB levels… labeled (most of the time)
(Support=Green, Resistance=Red, Trendlines=Blue) Fib will be labeled if any and their colors will vary.)
I start every position with .5 - 1% of my account and build from there as needed and as possible.
I am not your financial advisor. Watch my setups first before you jump in… My trade set ups work very well and they are for my personal reference and if you decide to trade them you do so at your own risk. I will gladly answer questions to the best of my knowledge but ultimately the risk is on you. I will update targets as needed.
GL and happy trading.
IF you need anything analyzed Technically just comment with the Ticker and I’ll do it as soon as possible…

what a strange strange game we playI have no words for this.
But i think its pretty safe to say whats coming next..
Look at the same spot on a 3 or 5 min chart. and i bet you too will start getting excited.
3/11 190p for me.
Good luck.

Clear as day distribution Familiar with Wyckoff?
if so sure you see the chart playing as it should. clearly in phase D.. almost phase E.
IF not, do some reach, pull up a distribution diagram. This is text book.
Also something to note, Elliot 5 wave theory puts us in the same spot.
Not to be forgotten. there is a gap a 165.
Give it 3 or 4 weeks and this will back to pre covid levels.
I see 188 by Wednesday.
Good luck.

IWMThe chart pattern today looks similar to how it looked in December. Today would put us around December 27th where price consolidated for about a week after then moved up to test the 50 sma before a sharp drop. Just an observation.

Small Caps Poised to RallyConsolidation looks like its nearing the end, small caps are poised to outperform on the rising rates story and an "improving" economy. Seeing higher moves up on less effort, Point and Figure methodology points to a significant break out.

$IWM Prepares for massive selloff following global crisesBearish Midterm...Will keep a track of this to see how it does.

IWM RST drown in 2021Will be interesting to see if this level is support for a while. Also the RST I drew last year sure worked , wow if it sees the high line.

IWM - Looks like small caps might be in for a bit more hurtThe daily chart from the Covid crash to the peak of the Covid recovery paints a picture of the Russell 2000 that is eerily similar to a textbook sketch of Wyckoff's distribution theory.
For the bulk of 2021 IWM respected a very clear support line that has been crashed through in 2022. Recent price action shows that old support being tested as a new resistance and buyers attempting to push prices through that level were flatly rejected. Furthermore, volume began spiking on drops in price below the 200 day moving average and any movement above it recently was met with anemic volume. This is not the excitement that we've been accustomed to in the small caps of 2020.
The game has changed.
With 1/3 of the Russell (at least) being non-revenue producing speculative companies that were exponentially over-valued during the 2020 bull run, it's hard to imagine that the grounding of the Russell isn't real and that it isn't coming. In today's market, giants like TSLA, AAPL, and MSFT are being dragged down to fundamental value. The small caps aren't immune, unfortunately. What's even worse is that a correction to AAPL's charts isn't as ghastly as some small caps that are trading at tens or hundreds of millions above their quarterly earnings.
The Russell is an important index to watch if one is interested in small cap boomers. It serves as not only a tradable ETF but as a thermometer for the sentiment toward speculation. Right now, it appears that bullish sentiment and risk taking is waning and bearish sentiment is growing. This could lead to a gut wrenching performance for small caps going forward into 2022 and larger drops in former penny stocks that retail investors drove to epic heights in 2020 and early 2021. Many of these companies are still heavily overvalued after 50%+ drops in share prices.
I'd expect volatility in the coming months as tax returns are pumped into these old favorites with the rallying cries of "buy the dip" and "moon next PR" on the breath of most novice investors and traders, especially those who are holding bags likely exponentially higher than current share prices. Once that surge of small money ends I would think that an abysmal summer is approaching for many of these strongholds.
Most of the companies have made lofty promises and many of them have targeted this summer for validation of their business models and strategies. But in the face of generationally high inflation, wars, rate hikes, and supply chain disruptions along with a pandemic that is cyclically impacting humanity, will it matter?
If Mr. Russell is any indication of what is to come, that answer is likely no. Spiking prices will likely be met with hard sell-offs and shorts that start to feel the squeeze will get a layer of protection from the trapped bulls just looking to get their money back out of the markets.
It's not the best of news, but it shouldn't be considering that we aren't in the best of economic situations currently. Of course this is the markets and the markets have a mind of their own. It's wise not to get too caught up in bias and predictions to the point where you are unable to react appropriately and according to your plans.
Good luck out there and God bless!!

need to break local trend, bullish rally if it happens 👀if IWM can cross the local trend resistance then we can target 207.08-209.80 local resistance area, a break above that and we can hit 215-229-243
If we fail to break local resistance a dip back to 190 is possible, like and follow for more! 💘

Rolling (IRA): IWM March 4th 185 Short Put to April 8th 175... for a 1.58 credit.
Comments: With 7 days to go and with the short put at >50% max, rolling this down and out to the April 8th 175 strike, which is paying around 2.10. I've collected a total of 4.08 in credits relative to a current price for the 175 short put of 2.05, so have realized gains of 2.03 ($203) so far.