JD/N trade ideas


JD.comBeijing continues to attack the tech sector, and even Katie Wood and Ark Investment Management have recently dumped shares in Chinese tech companies.
Since July 5, ARK has sold over 610,000 shares of JD. All investment companies are unanimously intimidated and announce the sale of shares of Chinese companies.
There was a significant sell-off in the Chinese tech sector on Friday, in part due to tighter regulatory controls from China. However, let's look from a technical point of view, excluding informational influence.
JD .com shares have been trading in the 70-80 channel for 3 months and amid all the news, the shares held at 70 and rebounded from it. On the daily chart, you can see the paranormal volume of sell deals, which was bought out and the daily candle with a long hairpin is a good confirmation of this. The instrument has sufficient power reserve and the stocks are stronger than the market.
Search for a long entry point at the market open, now the point cannot be determined due to fundamental news. You should wait for the start of trading. I think take Take 1 to 7 if there is good volatility.

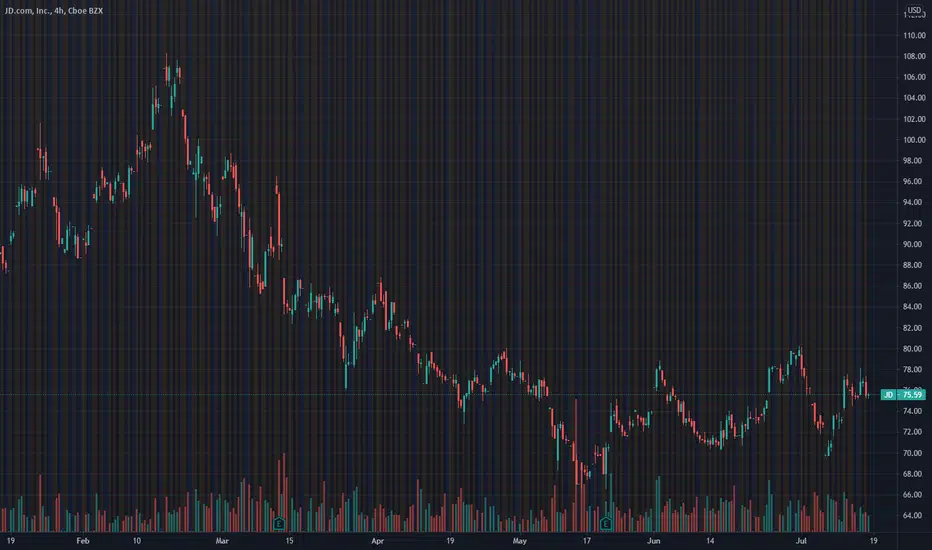
JD Idea 7/9/21Looking like a support bounce off $70, looking for upward move towards $80 for a resistance bounce. If it gets above +$80, we can really see this thing shoot up into the 85s.
Please let me know what you think in the comments. Thank you!
4hr chart

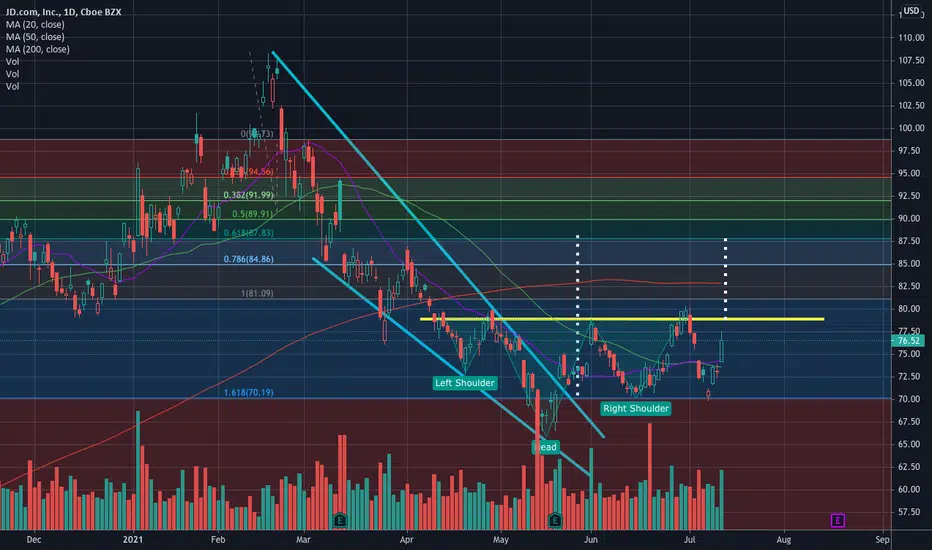
$JD - Target $88JD playing out inverse head and shoulder and bullish descending wedge.
If JD can break above neckline $80, it can hit $88.
Neckline - $80
Target - $88
———————————————————
How to read my charts?
- Matching color trend lines shows the pattern. Sometimes a chart can have multiple patterns. Each pattern will have matching color trend lines.
- The yellow horizontal lines shows support and resistance areas.
- Fib lines also shows support and resistance areas.
- The dotted white lines shows price projection for breakout or breakdown target.
Disclaimer: Do your own DD. Not an investment advice.
$JD | Inverse Head and Shoulders Formation$JD is forming a bullish inverse head and shoulders pattern. I expect price to push up to the neckline & go much much higher after a breakout.
Initial Targets $80 | $85


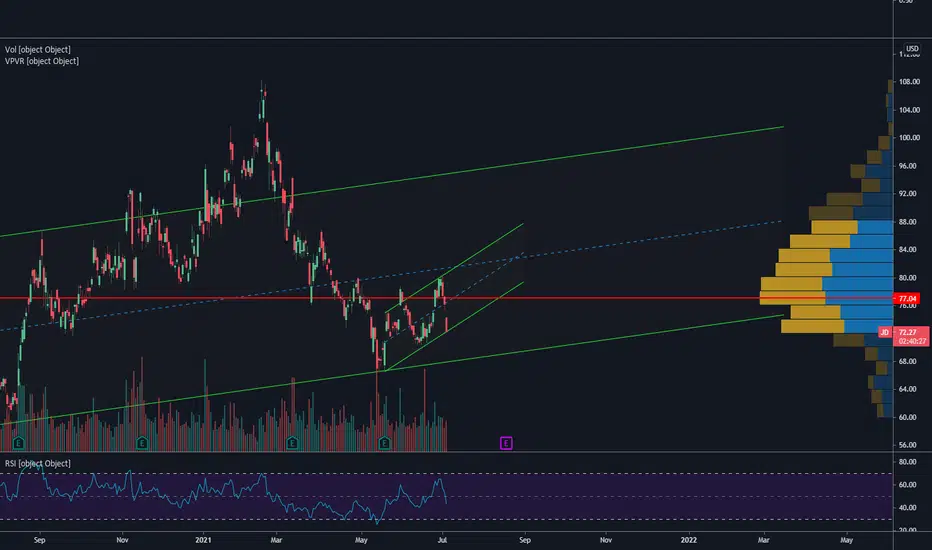
JD BUY OR LONG, TARGET $108 AND $130JD confirmed a " Symmetrical triangle " at the bottom of the Q1 2021 correction and now the
price is moving up and a new bull cycle has begun with its initial target of the old top of $108.
Good luck.


JD may add some shares on this dip. watching for nowhello everyone please leave a like and follow if you enjoy my ideas :) if you have any questions feel free to dm me here or comment down below. goodluck <3

JD.Com double bottomed and W pattern evidently clear!Seems like JD.com has now double bottomed and formed a clear W pattern. This is quite bullish and the next move should be UP! Potential technical target would be around $92

JD ShortProbably going to pair trade this with BILI calls so I don't get effed by pumptard strength.
Massive OI at 80c's for this week. MM's will try to force this down. See PDD and 130c OI.

$JD - H&S and bullish setupThe chart tells on it's own.
Classic setup; however, need to see if 80 resistance is broken.
T1: 80
T2: 87
T3: 95

JD.com is a BUY nowThis is a pattern I have talked about in the past and it is a combination of a distribution pattern (in this case a Wolfe wave) and a reversal pattern within the accumulation phase (in this case a reversed head and shoulder). I bought this in my investments accounts and is a long term hold for me.

JDJD Long🚀📊
It is not financial advice. This is my opinion. Please check yourselves and invest in the symbols in which you think have a huge opportunity to reach the best results.
please leave us your opinion and reviews.🙏
Good Luck 👍


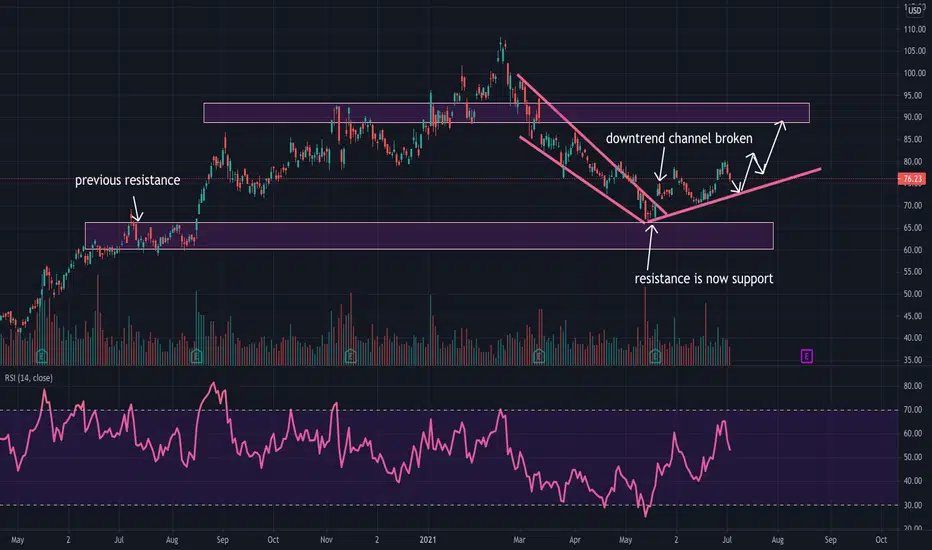
$JD - up to 100?Fib-retracement and break-out of the downtrend
Analysts bullish
Tensions over Chinese tech sector reducing
All indicate back to fair valuations

