JPM - ER Run-Up: Low risk scalpTrigger to go long is on break of 157.68. Upside price targets are above. You can scalp weeklies on this one as they report ER on the 14th.
JPM trade ideas

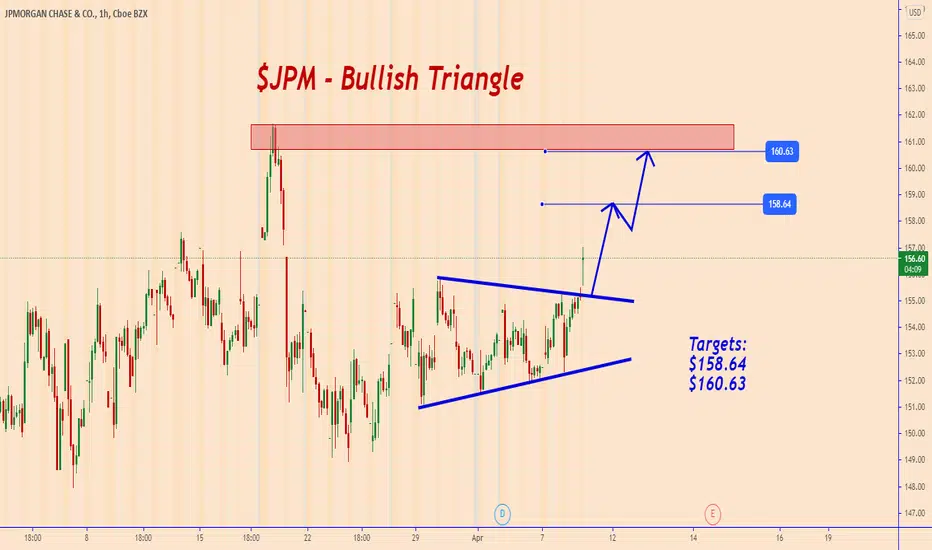
JPM: Bullish Triangle$JPM tested the support line of the bullish triangle and after that we saw a clear bullish reaction.
$ JPM has its Earnings Report as of April 14, 2021.
Targets:
$158.64
$160.63
Thank you and Good Luck!

JPM: Bullish trend ahead of the earnings report
Share prices have breached the resistance trend line at 154.70 after many attempts as indicated on the chart and closed the last session 156.35 up 0.75%.
The major levels to the upside are at around 157.60, 158.70, 160.50, 161.60, 163.40
Support at around 154.70, 152.90, 151.77, 150.00, 148.90, 147.78, 147.00

$JPM Before earningsJPM is looking at a retest of that 160 target I had a few days ago. As expected, algos took profits and it put in a bearish candle at the top. It seems like JPM has been trading inside a very range for a while, and if earnings posted are good, it should break higher, looking at 160 calls that should be paying nicely on this swing. All indicators show a bullish trend to the upside, especially the Stoch RSI. There is a slight bearish divergence on the Ichimoku indicator that is showing near term bearishness. I like this setup to retest the highs at or after ER.

JPM Breakout ImminentJPM, along with other value stocks within the financials, travel, and industrial sectors, have seen relative strength during the recent market sell off. I'd like to see JPM close over 155 for a move up to the low 160s, but seems like it needs to reclaim and bounce from the 20 day EMA first.

$JPM 4/8/2021$JPM is going to be a benefactor in the future eventually when rates rise.
I also like the TA set up they are right above the 50 day MA and following down to the bottom trend line. Looking back on the consolidation they had in November I think they are prime for a little bit of a run up after breaking that resistance it has touched multiple times.
I would buy from here down to $148.61 that's the next big support
PT $170, $175

JPM beaurful bull flag JPM looks ready to make a big move . Bull Flag
April,16 earning day
Good Luck

Cup and Handle Rising wedge Earnings 4-14 BMOJPM has been in several rising wedges and is in another one now. (I did not draw all of them) JPM appears to have pierced the bottom trendline of the rising wedge it is traveling in now. That may be all there is and may not fall any further.
Rising wedges are long term patterns and a security can go a long way inside of one without ever even peeping out. Rising wedges are most often bearish and interrupt supply and demand.
Earnings in a few weeks. I think they are expected to do well.
This stock has definitely outperformed and the chart is bullish, except for that wedge. Strong support can catch price though so do not mean to sound bearish. There is a lot going on in this chart including a possible bull flag.
Not a recommendation.
In a rising wedge you will see a lack of touches at some area, or areas, where price failed to touch trendline. When you draw the upper and lower trendlines, they will converge at the apex. A broadening wedge looks different. A broadening wedge looks like a megaphone and the 2 trendlines become wider and wider as you draw them. A broadening wedge is not necessarily bearish, a rising (ascending) wedge usually is bearish. If you have owned a stock that seems to bounce around going almost nowhere..ie BABA, then you may be dealing with an ascending broadening wedge. No pattern lasts forever though and eventually the broadening wedge will choose a direction. A broadening wedge can make lower lows and higher highs so not always a bad thing, until it hits the top and travels down again. But nothing stays the same forever (o:

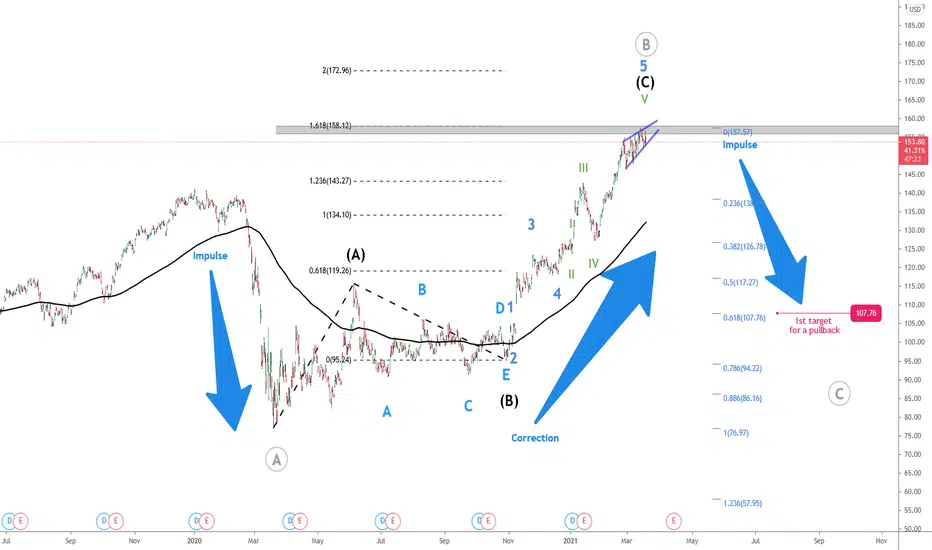
JPM: Gearing up to make another ATHThis chart might not look that technical...but, it's accurate...to the best of my knowledge.
After a nice deathly pull-back, JPM is ready to go another leg to beat their ATH...Good luck.

MS 🌦All systems go... down! I'm very bearish on banks. I expect yields to start falling back down and with it usually comes the bank sector.

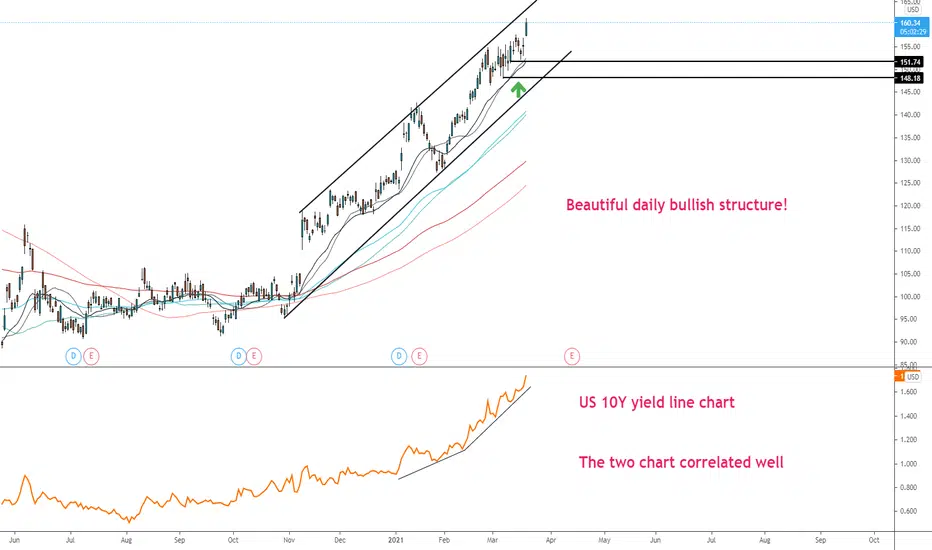
Daily Bullish setup of JPM who benefits from the yield surge!US 10Y yield has been surged for a few days. I mentioned why I'm bullish in the related ideas almost one month ago when the price of JPM sat around 150.
Now, it's 160, not bad compared to Tech stocks! It's necessary to include stocks in the banking sector under such circumstance.
As inflation is still low, I recommend to buy the dip until late Q2 when we might see inflation surpass key levels.
JPM (NYSE) - Bullish Trend
Greetings
Humbled, we would like to thanks for your support who has already liked, commented and followed us. Your support, strengthens us, to help in analyzing the market. If you have any questions, feel free to send us message (inbox).
Pra Trading :
- Please care for Money Management
- Have a good psychology
- Do not be hurry to open position and do not do nothing if u see opportunity
- Evaluate and upgrade your trading plan
Execution Strategy :
- Know what you want to buy, see the Fundamental
- Decide that you are on investing or speculating
- Consider what your strategy based on Investing/Speculating
- Make Road Map Of Your Trading Plan
- Decide
a. Entry strategy
b. Cut loss
c. Target of Profit
Post Trading :
a. Do not be sad if you loss or do not be very happy if you win
b. Just become a normal without emotion, Do not put emotion into your trading
c. Evaluate your trading
d. Keep on Learning
e. Be Humble
Idea :
JPM (NYSE) - Bullish Trend
Note :
1. This is just a road map
2. After u know the rod map, u need to decide what is the entry strategy, and exit strategy where we do not explain here. if u will know more, let send us message
3. If your information/knowledge is intermediate, it is very dangerous to do trade.

$JPM Ready to test highs againAlgos have this pinned right at that conversion line and 8 Daily EMA. Flirting with overbought RSI, it has made a steady climb up to higher highs. I've set 160 as a psychological level to break, but the way it has been moving, it could move much higher. $XLF looks strong as well, indication higher highs for the entire financial sector. Targets should be short term, ready for a quick drawback if it fails to break out of these levels.

$JPM Pullback IdeaOK, this is quite a risky idea, and I´m not trading it until I see price action that signals a pullback is underway.
But I wouldn´t put my money in any longs right now either.
JPM showing bearish divergence on daily. Provided it does not breakout, The corrective patterns suggests a move downwards.

JPM's potential short upmove!Daily chart showing an upsloping pennant pattern. We should see a short burst of at least $5-6 up move in the next 1 to 2 weeks.
Target profit 1 = $160
Disclaimer: I'm not giving any trading and investing advice. Just sharing my chart observations.
If you have any symbols that you'd like me to analyze, feel free to drop me a comment.
Thanks!


JPM Ascending TriangleTon of support at this level, with financials back in play we could easily profit even if the market decides to pullback. Need a breakthrough this beautiful ascending triangle setup and we'll see 160+ in no time.

blow off top coming The paper chasing here is comical. Value guys jawboning the end of days for tech meanwhile they have their own bubble forming on account of a 30 bips freakout on the 10 year. 👌🏽
Rolling puts hard into April.

$JPM Daily breakout planSimple plan for tomorrow, looking for a breakout above 155. RSI is still peaking towards the upside and MACD is about to cross again on the daily.


JPM elevator up by Black Bond ThursdayThursday's bond auction could lift JPM to ATH and this is what it will look like. Key levels at 153.75 and 155 .50 could allow for 160 end of week.
