JPM (NYSE) - Bullish TrendGreetings
Humbled, we would like to thanks for your support who has already liked, commented and followed us. Your support, strengthens us, to help in analyzing the market. If you have any questions, do not be hesitant to send us message (inbox). Our Service : Signal recomendation, Trading Course, Portofolio Consultation for multi asset such as Stock, FX, Derivative, Crypto, etc
Strategy
- Please care for Money Management
- Have a good psychology
- Do not be hurry to open position
- Evaluate and upgrade your trading plan
Analysis
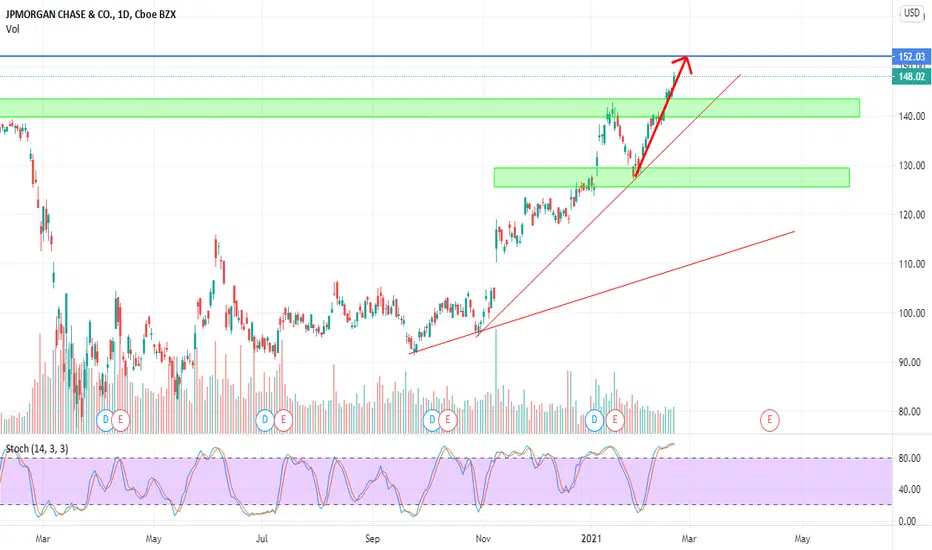
JPM (NYSE) - Bullish Trend
JPM trade ideas


JPM Bearish to 150 areaIf you look at JPM on a Weekly chart its at the upper end of the range...
On the hourly this is the third time it's attempted to break above 155
Options open interest is centered around the 150 level
Like to see JPM back towards the support level
Could see a scenario where rates cool off...banks pull back and tech catches a bid...little rotation action maybe in the cards
Funny to watch both banks and big tech suck-up so hard to those in political power


$JPM Long to 195I see JPM as having the most upside out of BAC GS MS, with the stock buybacks and earnings report.

Traditional|JPM|LongLong JPM
Activation of the transaction only when the blue zone is fixed/broken.
The idea is to work out the resistance level .
* Possible closing of a trade before reaching the take/stop zone. The author can close the deal for subjective reasons, this does not completely cancel the idea and is not a call to the same action, you can continue working out the idea according to your data, but without the support of the author.
+ Maybe right now we will go even lower, then it's okay, the idea is not activated and simply canceled.
The "forecast" tool is used for more noticeable display of % (for the place of the usual % scale) of the price change, I do not put the date and time of the transaction, only %.
Blue zones - activation zones.
Green zones - take zones.
The red zone - stop zone.
Working out the stop when the price returns to the level after activation + fixing in the red zone.
Orange arrow - the direction of take.
Blue arrow - neutral scenario without activating the trade.
The red arrow - the direction of the stop.
SUM PNL: This parameter displays the total % of all closed ideas of the "new" format (according to the author) for this sector at the time of publication of the idea. The calculation is very "clumsy" just the sum of the profits of all the ideas, based on this indicator, you can more accurately assess the risks when working with my ideas of this sector. I present you the construction of the idea, you can use it yourself as you like based on your subjective view and risks, the calculation of the PNL indicator is carried out only on transactions that the author closed on TV in manual mode or by take.
P.S Please use RM (risk management) and MM (money management) if you decide to use my ideas, there will always be unprofitable ideas, this will definitely happen, the goal of the system is that there will be more profitable ideas at a distance.


JPM (DJI) - Reach near targetHumbled, we would like to thanks for your support who has already liked, commented and followed us.
Your support, strengthens us, to help in analyzing the market.
JPM (DJI) - Reach near target
The Behavioral Selling that Could Occur with JPMThe extreme space between support and resistance levels could trigger a behavioral risk with this equity. The impact that these big financials carry for the market and their importance for the overall security of the markets is critical right now. The extreme gaps of support and resistance leaves one to question, "Where can I safely enter?"
There isn't much under the chart. The magnitude of the drop could be devastating and go beyond fundamental reasoning...

JPM 1HRBEARISH ALT BAT
price need to follow Green Trend line & hit target
If price Breaks Red Trend line is where EXIT before SL hits
POTENTIAL SELL
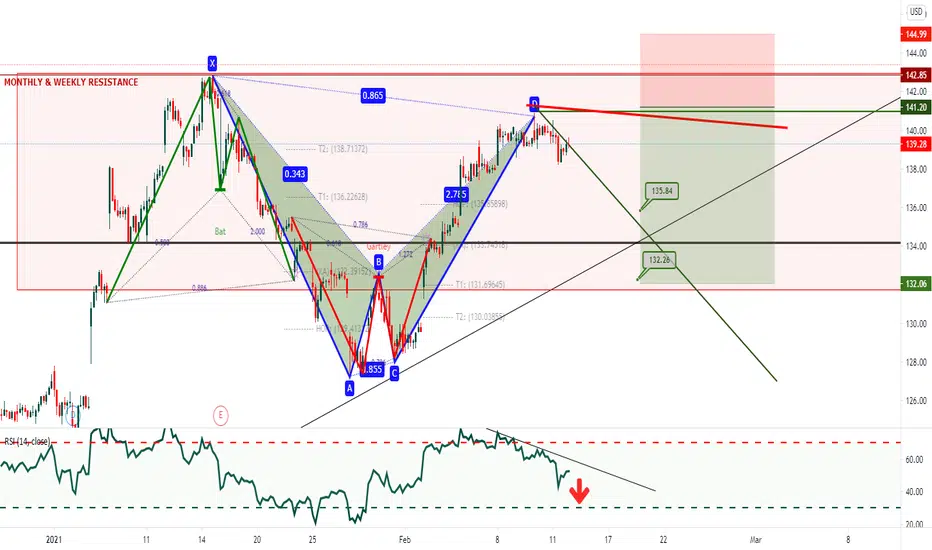
JPM 4HRBEARISH Alt BAT
price need to follow Green Trend line & hit target
If price Breaks Red Trend line is where EXIT before SL hits
POTENTIAL SELL


$JPM strong upside continuation$JPM is continuing upside after the strong bounce off the 127 upside support to target 160


JPM short trade updated chartHere is the updated chart on JPM short trade I have posted on January, 12th. Brief pop above the resistance level to clear out any shorts. Turning around and dropping down below which proves to be a bull trap. From there, pretty steady down trend day after day. Today, hitting the first target. 10.5% down from the high. Next target is $117.20ish level and reaction is likely once it gets there. I expect a gap down tomorrow and hitting that second target pretty quick given the current market posture. Around $104.50 seems like a good support and that seems like a pretty good swing target and which will be around 26% from the high. How bullish the overall sentiment is, I can see very quick rush to the exit once it turns.
Have a good trade everyone,
T.


JPM Potential ReversalJPM has held the 20day so I am looking for a reversal. I will be paying attention to banking and specifically BAC and AXP because of the similar charts. I want to see a break of recent highs and the trendline above.

JP Morgan===24/1/2020
JP Morgan Chase & CO.
Waiting Buy 132.52 or 125.89
TP 1 : 144
STOP LOOSE : 122.39
