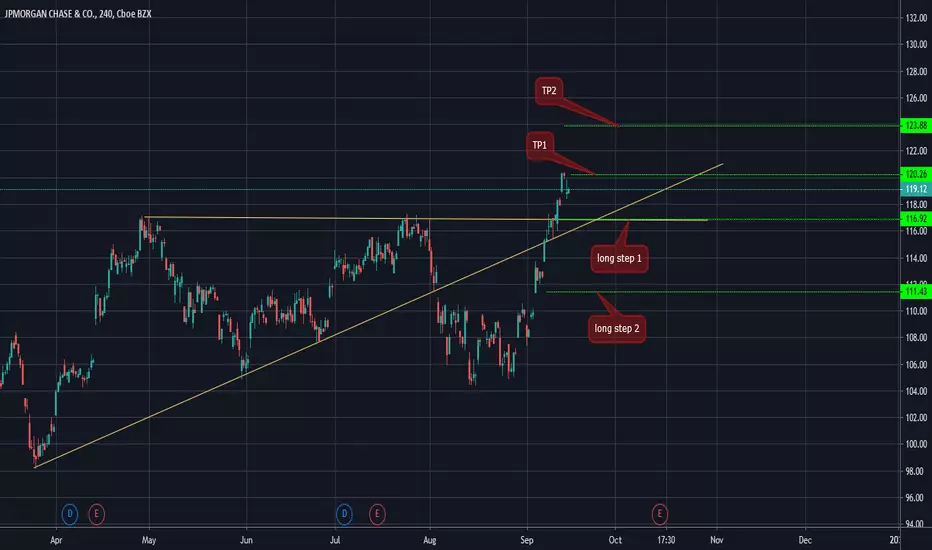
Maybe a HCH is forming in JPM.Banks stocks are part of the rotation, so this is one of the most clears chart patterns and healthy fundamentals support it.
JPM trade ideas


JPM possible short setup going into earningsJP Morgan is ranging from the past three months, and its at the highest point in the range.
Stochastic indicator is entering into the zone
If it closes below 117.23 i.e the next support level, will go short with risk:reward of 1:1


JP Morgan update double topForming a double top at all time high level with good divergence on indicators. Neckline was previously strong resistance, so a break through it should give high probability for a short.
Majority of funds and banks price target this stock below $100 level.
Considering that indices could be topping, this could signal beginning of the downturn in equities.
Good Luck!

38.2% & POSSIBLE 61.8% Retracement LONG GWAVE38.2% & POSSIBLE 61.8% Retracement LONG GWAVE.
FIB Retracement Percentage is calculated in a Higher Cartesian and or Euclidean Dimension.
PLEASE ALWAYS WAIT FOR STOCHASTIC CONFIRMATION!!! THANKS


JPM - Chase Bank - Weekly 34 SMA v 500 Hull... Royal Rumble... JPM - Chase Bank - Weekly 34 SMA v 500 Hull... Royal Rumble...

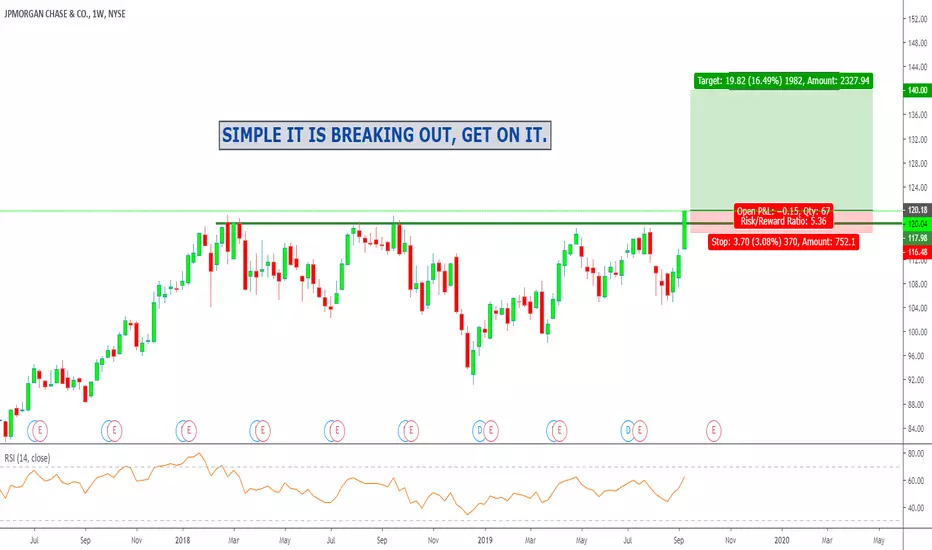
JMP Breakout implies 20% upside This breakout from a 1.5 year consolidation could be significant... if it holds.

JPM all-time highsHoping this pulls back enough to jump in. Stop at previous weeks' low and below monthly support line.


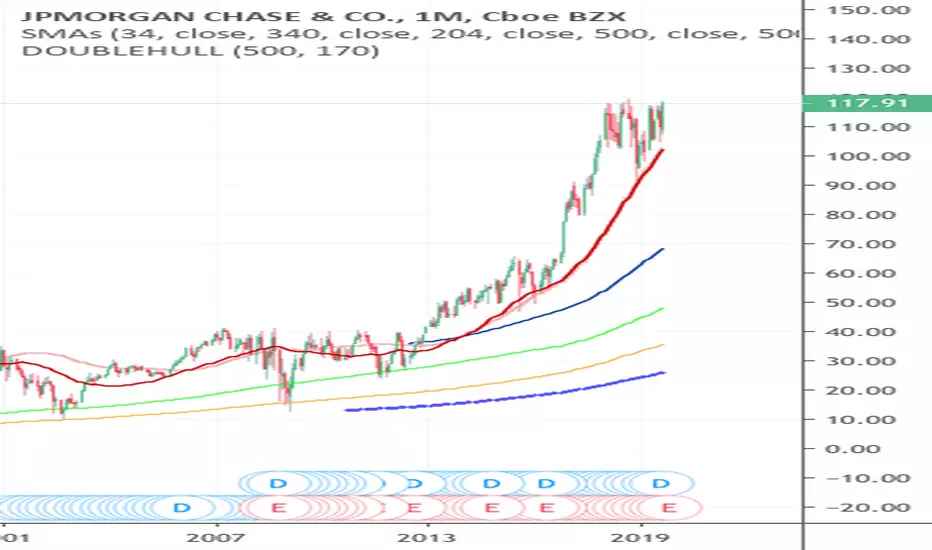
JPM - Chase Bank - Only Worth $50 (204 Month SMA)...SoMuchRisk!!JPM - Chase Bank - Only Worth $50 (204 Month SMA)...SoMuchRisk!!

JPM - Chase Bank Crashed until Mid 2021 - Crooked BankersJPM - Chase Bank Crashed until Mid 2021 - Crooked Bankers


JP Morgan Breaking out. JPMorgan Chase & Co. is a financial holding company, which provides financial and investment banking services. It offers a range of investment banking products and services in all capital markets, including advising on corporate strategy and structure; capital raising in equity and debt markets; sophisticated risk management; market making in cash securities and derivative instruments; and prime brokerage and research. It operates its business through the following segments: Consumer and Community Banking; Corporate and Investment Bank; Commercial Banking; and Asset and Wealth Management. The Consumer and Community Banking segment serves consumers and businesses through personal service at bank branches and through automated teller machine, online, mobile, and telephone banking. The Corporate and Investment Bank segment offers a suite of investment banking, market-making, prime brokerage, and treasury and securities products and services to a global client base of corporations, investors, financial institutions, government and municipal entities. The Commercial Banking segment delivers services to U.S. and its multinational clients, including corporations, municipalities, financial institutions, and non profit entities. It also provides financing to real estate investors and owners as well as financial solutions, including lending, treasury services, investment banking, and asset management. The Asset and Wealth Management segment provides asset and wealth management services. It offers investment management across all major asset services, including equities, fixed income, alternatives, and money market funds. The company was founded in 1968 and is headquartered in New York, NY.

JP Morgan updateTrade closed on the long as we test resistance. Now overbought testing confirmed highs. Great risk-reward for a short here. Looking at smaller time frames after US session opens to time the entry. JPM was downgraded by several equity funds. They have a market cap of $372.89B.
Good Luck!

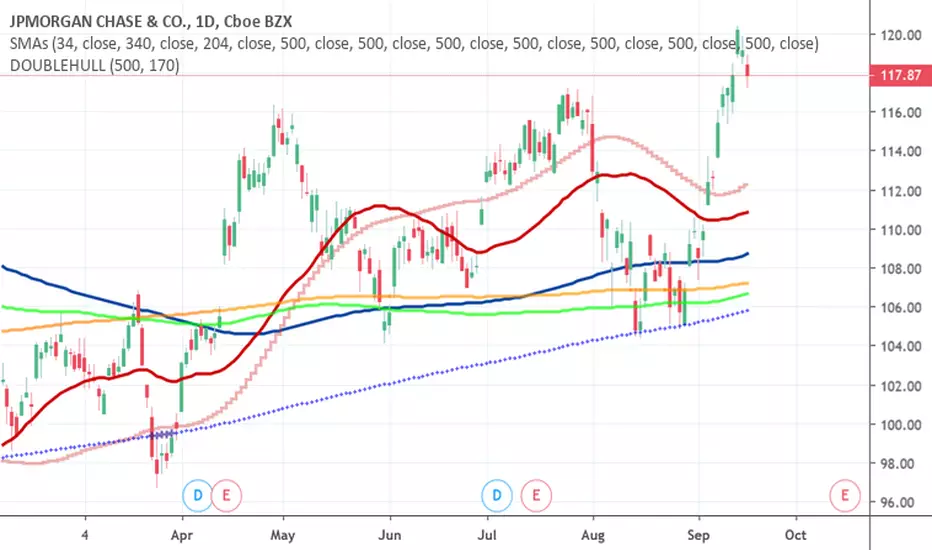
Analysis of JP MORGAN 11.09.2019The price above 200 MA, indicating a growing trend.
The MACD histogram is above the zero lines.
The oscillator Force Index is above the zero lines.
If the level of resistance is broken, you should follow the recommendations below:
• Timeframe: H4
• Recommendation: Long Position
• Entry Level: Long Position 117.10
• Take Profit Level: 119.00 (190 pips)
If the price rebound from resistance level, you should follow the recommendations below:
• Timeframe: H4
• Recommendation: Short Position
• Entry Level: Short Position 115.50
• Take Profit Level: 115.00 (50 pips)
USDJPY
A possible long position at the breakout of the level 107.85
GOLD
A possible short position in the breakdown of the level 1483.00
USDCHF
A possible long position at the breakout of the level 0.9945
GBPUSD
A possible long position at the breakout of the level 1.2390

JP Morgan Chase Big Picture AnalysisJPM is interesting at the moment. I have 3 Szenarios at the moment, take a look at the video for more

SIMPLE STRATEGIES 2- HOW TO CREATE PASSIVE INCOME FROM STOCKS? So you have tried to daytrade but its wasn't for you. You lost to much money, the market seemed to you more like a casino... irrational. You tried investing but it was no different. Some stocks go up ....some go down at best you breakeven. How the f.... do you choose this stocks to invest? The indicators are lagging, the news move too fast, the big guys manipulate the market and you end up always in the wrong side of the market. There is a simple strategy for that ...you buy BLUE CHIP stocks. This are stocks that give you dividends regularly. Its like buying real estates and giving them for rent. Its simple, clear. It doesn't matter which way the stocks go as long as the company has sound financial statements and gives dividends regularly.
As you can see there a sign at the bottom of the chart with the letter D. Those are all dividends. this are just some good examples of good companies, giving good dividends.The markets offer a lot of possibilities, Its up to you to choose which financial instrument is more suitable for you personality.
