LEN Entry, Volume, Target, StopEntry: with price above 133.24
Volume: with volume greater than 1.87M
Target: 138.27 area (this is an area, no guarantee it reaches this price, but you should be selling on the way up)
Stop: Depending on your risk tolerance; Based on an entry of 113.25, 130.74 gets you 2/1 Reward to Risk Ratio.
This LONG swing trade idea is not trade advice and is strictly based on my ideas and technical analysis. No due diligence or fundamental analysis was performed while evaluating this trade idea. Do not take this trade based on my idea, do not follow anyone blindly, do your own analysis and due diligence. I am not a professional trader.
LEN trade ideas

LEN Entry, Volume, Target, StopEntry: when price clears 117.54
Volume: average or better
Target: 129 area
Stop: Depending on your risk tolerance; 113.72 gets you 3/1 Reward to Risk Ratio.
This swing trade idea is not trade advice and is strictly based on my ideas and technical analysis. No due diligence or fundamental analysis was performed while evaluating this trade idea. Do not take this trade based on my idea, do not follow anyone blindly, do your own analysis and due diligence. I am not a professional trader.

LEN Lennar Corporation Options Ahead of EarningsIf you haven`t sold LEN here, for a quick profit:
Then Analyzing the options chain of LEN Lennar Corporation prior to the earnings report this week,
I would consider purchasing the 110usd strike price Puts with
an expiration date of 2023-7-21,
for a premium of approximately $2.67.
If these options prove to be profitable prior to the earnings release, I would sell at least half of them.
Looking forward to read your opinion about it.

$LEN Double TopNYSE:LEN has 2 Double top in December and 1 in may. Could this be the 2nd double top. Short here and and i will stop out on a daily close above the horizontal line.

LEN - W Pattern ExampleA W pattern on this 4Hr chart.
Basically price just plays out in the shape of a W with the right arm being the main bullish phase which can be seen on chart.
The middle does not necessarily have to be lower (as it is on this chart) for it to be a W pattern still.

Retest support. MACD Buy. Target 52WH1. Retest support.
2. MACD Buy.
3. Target 52WH
4. TAYOR & Good Luck

Weekly ChartEarnings estimated to be 6/12.
Weekly chart with a probable W pattern forming. This is most likely a Bat (4th leg ends at the .886) or an alternative Bat (1.113) and will reverse when target is reached.
No recommendation

Real Estate: Further Trouble Ahead until Bottom January 2025#ichimoku #realestate
Monthly Chart
1. Touched Top of Major Trend Line December 2021
2. Resistance at Top of Trend Line
3. Lower High/Lower Low Bear Channel
3. Ichimoku Death Cross
4. Kumo Cloud Flat
5. Target 45.13 January 2025
6. Ichimoku Time Theory Confluence - 9 Period + 26 period
Weekly Chart
1. Stochastic Death Cross

$LEN.B with a Bullish outlook following its earnings #Stocks The PEAD projected a Bullish outlook for $LEN.B after a Negative over reaction following its earnings release placing the stock in drift C.
$LEN with a Bullish outlook following its earnings #Stocks The PEAD projected a Bullish outlook for $LEN after a Negative over reaction following its earnings release placing the stock in drift C with an expected accuracy of 100%.

RectanglePrice appears to be bound by two horizontal trendlines.
Earnings 12-14 AMC.
I hear the talking heads speaking of lowered mortgage rates, but I did not dig in to what I heard.
I think I do better if I do not hear them sometimes (o: They continuously talk about what the Fed is planning to do with rates all day long, and I do not think they know anymore than we do. LOL I doubt even Powell knows for sure.
It is like a few weeks ago, the housing bubble was supposed to bust and not it is not?
Nothing ceases to amaze me.
Neutral pattern until broken.
No recommendation.
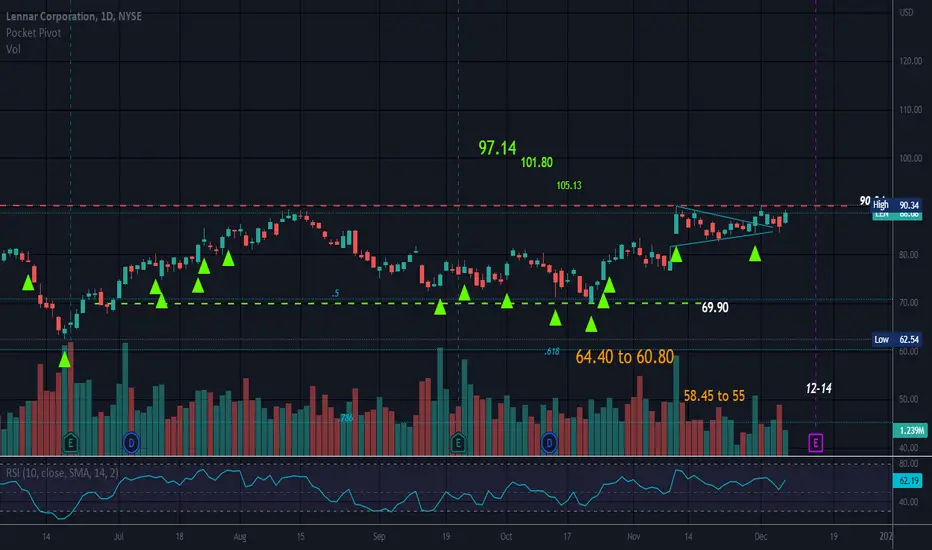
RectangleNeutral until broken.
Earnings estimated to be on 12-14 AMC.
Earnings estimates are lower than last quarter.
Small symmetrical triangle that is also neutral until broken.
Difficult industry right now but a great stock.
Short interest around 3.57%
No recommendation

Which way is LEN headed?Appears that Lennar is headed from bearish to bullish trend, however it did not cross the August high resistance levels. Will LEN check back to the 150 day moving average? or will it break trend and cross the resistance level. I'm leaning to checking back based on macro. Higher rates and poor customer traffic will hurt top line and/or margins. Builders are having to provide incentives (buy points, discount, etc) in order to drive sales.

$LEN with a Bullish outlook following its earnings #Stocks The PEAD projected a Bullish outlook for $LEN after a Positive Under reaction following its earnings release placing the stock in drift A with an expected accuracy of 71.43%.

LEN 9/22/2022LEN
Daily chart analysis
LEN is currently in a downtrend under the 200 ema
After reaching low of 64.00, pulled back and broke above resistance level at 81.00
The breakout is deemed a failed breakout after price falls back below 81.00
Price has the followed by making a series of lower lows creating a downtrend line
Price is currently at resistance from down trendline, an area of value.
This is my cue to enter trade short.
Entry: 75.81
Stop loss: 81.92
Target: 64.00, +15.58%, 1.93 RR ratio

LEN Lennar Corporation Options Ahead Of EarningsLooking at the LEN Lennar Corporation options chain, i would buy the $71 strike price Puts with
2022-9-23 expiration date for about
$1.00 premium.
Looking forward to read your opinion about it.

housing slow down incoming? BEARISH DEATH SOMBRERO DETECTEDsombrero pattern detected (yes i know, sarcasm)
XHB XLRE WMT IYR DIA VT XLY

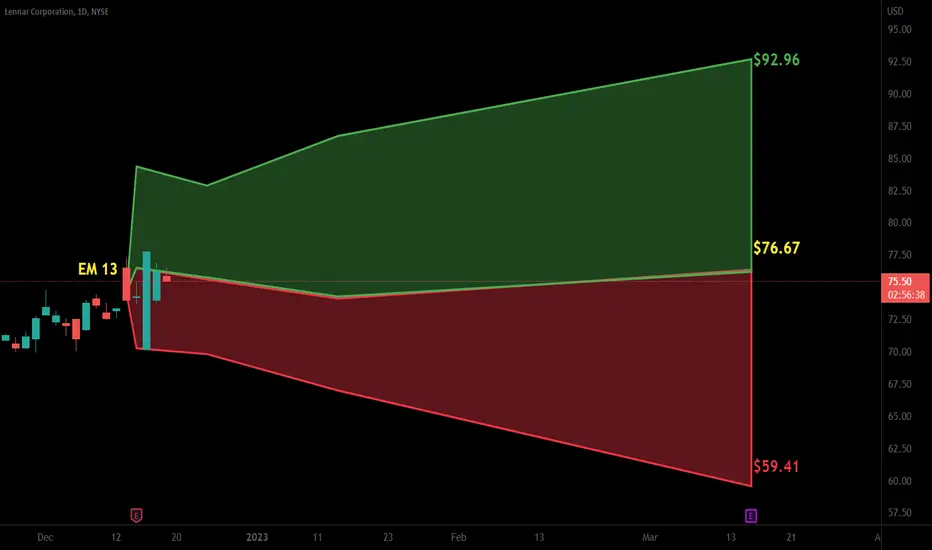
LENNAR appears overboughtBased on historical movement, the peak could occur anywhere in the larger red box. The final targets are in the green boxes. The pending bottom should occur within the larger green box as has been the historical case. Half of all movement has ended in the smaller green box. In this instance, the signal indicated SELL on July 21, 2022 with a closing price of 82.08.
If this instance is successful, that means the stock should decline to at least 81.65 which is the top of the larger green box. Three-quarters of all successful signals have the stock decline 2.218% from the signal closing price. This percentage is the top of the smaller green box. Half of all successful signals have the stock decline 4.588% which is the end point of the black dotted arrow. One-quarter of all successful signals have the stock decline 7.85% from the signal closing price which is the bottom of the smaller green box. The maximum decline on record would see a move to the bottom of the larger green box. These are the same concepts for the levels in the red boxes as well.
The ends/vertical sides of the boxes are determined in a similar fashion. The trough of the decline can occur as soon as the next trading bar after signal close, while the max decline occurs within the limit of study at 40 trading bars after the signal. A 0.5% decline must occur over the next 40 trading bars in order to be considered a success. Three-quarters of successful movement occur after at least 11 trading bars; half occur within 23 trading bars, and one-quarter require at least 35 trading bars.
The black dotted arrow represents median historical movement. Medians are a good metric, but they are just one of many I use when forecasting future movement.
As always, the stock could decline the very next bar after the signal without looking back (therefore the red boxes would not come into play) or the stock may never decline (and the green boxes may never come into play).

NEW SWING TRADE ON LEN - Bullish ;) Love the compression, hammer inside candles above the 10, 20, and 50 ema
Double bottomish with increasing volume

LEN - Uptrend ContinuationSimilar positions in grey circles
These circles are preceded by similar patterns
Uptrend should stay intact on this weekly timeframe and continuation result

6/5/22 LENLennar Corporation ( NYSE:LEN )
Sector: Consumer Durable (Homebuilding)
Market Capitalization: 23.216B
Current Price: $80.19
Breakout price: $81.10
Buy Zone (Top/Bottom Range): $79.55-$69.45
Price Target: $99.10-$102.40
Estimated Duration to Target: 237-240d
Contract of Interest: $LEN 1/20/23 85c
Trade price as of publish date: $8.50/contract

HIGH RISK LEN Initial Long on the dailyHIGH RISK LEN Initial Long on the daily. TPs and SL on the chart. Max margin/leverage or call option play.

28/4/2022 NYSE (LEN)Short (Entry Price) within the sell zone area and exit (Stop Loss) above the red line. Can take profit at the suggested Target Price.
Entry Price: $75.39 / $77.43
Target Price: $73.44 / $76.22
Stop Loss: $78.64
