Li Auto: Scope to move lower? Li Auto
Short Term - We look to Sell at 22.46 (stop at 24.15)
Preferred trade is to sell into rallies. The medium term bias remains bearish. The trend of lower highs is located at 29.60. The bias is still for lower levels and we look for any gains to be limited.
Our profit targets will be 16.90 and 16.22
Resistance: 22.50 / 25.00 / 30.00
Support: 100.00 / 17.00 / 15.00
Disclaimer – Saxo Bank Group. Please be reminded – you alone are responsible for your trading – both gains and losses. There is a very high degree of risk involved in trading. The technical analysis, like any and all indicators, strategies, columns, articles and other features accessible on/though this site (including those from Signal Centre) are for informational purposes only and should not be construed as investment advice by you. Such technical analysis are believed to be obtained from sources believed to be reliable, but not warrant their respective completeness or accuracy, or warrant any results from the use of the information. Your use of the technical analysis, as would also your use of any and all mentioned indicators, strategies, columns, articles and all other features, is entirely at your own risk and it is your sole responsibility to evaluate the accuracy, completeness and usefulness (including suitability) of the information. You should assess the risk of any trade with your financial adviser and make your own independent decision(s) regarding any tradable products which may be the subject matter of the technical analysis or any of the said indicators, strategies, columns, articles and all other features.
Please also be reminded that if despite the above, any of the said technical analysis (or any of the said indicators, strategies, columns, articles and other features accessible on/through this site) is found to be advisory or a recommendation; and not merely informational in nature, the same is in any event provided with the intention of being for general circulation and availability only. As such it is not intended to and does not form part of any offer or recommendation directed at you specifically, or have any regard to the investment objectives, financial situation or needs of yourself or any other specific person. Before committing to a trade or investment therefore, please seek advice from a financial or other professional adviser regarding the suitability of the product for you and (where available) read the relevant product offer/description documents, including the risk disclosures. If you do not wish to seek such financial advice, please still exercise your mind and consider carefully whether the product is suitable for you because you alone remain responsible for your trading – both gains and losses.
LIA/N trade ideas

LI AUTOPrice still inside the yellow channel ,
(16.75$ -18$) is a good buying zone
We’re targeting : 25$ in the next 5 month
In general Li is one of the best electric car in china , having a great numbers ,
company for future
@REVENUE_JO


Li Auto Triple top breakout or breakdownAre Chinese stocks going to be devalued to oblivion or should we be snapping them up on the lows?

Li Support Breaking?Li Auto - Short Term - We look to Sell a break of 26.98 (stop at 28.34)
Trading within the Channel formation. The bias is still for lower levels and we look for any gains to be limited. Previous support located at 28.00. A break of 28.00 is needed to confirm follow through negative momentum. Risk/Reward would be poor to call a sell from current levels.
Our profit targets will be 22.54 and 21.60
Resistance: 29.00 / 33.00 / 35.00
Support: 28.00 / 25.00 / 20.00
Disclaimer – Saxo Bank Group. Please be reminded – you alone are responsible for your trading – both gains and losses. There is a very high degree of risk involved in trading. The technical analysis, like any and all indicators, strategies, columns, articles and other features accessible on/though this site (including those from Signal Centre) are for informational purposes only and should not be construed as investment advice by you. Such technical analysis are believed to be obtained from sources believed to be reliable, but not warrant their respective completeness or accuracy, or warrant any results from the use of the information. Your use of the technical analysis, as would also your use of any and all mentioned indicators, strategies, columns, articles and all other features, is entirely at your own risk and it is your sole responsibility to evaluate the accuracy, completeness and usefulness (including suitability) of the information. You should assess the risk of any trade with your financial adviser and make your own independent decision(s) regarding any tradable products which may be the subject matter of the technical analysis or any of the said indicators, strategies, columns, articles and all other features.
Please also be reminded that if despite the above, any of the said technical analysis (or any of the said indicators, strategies, columns, articles and other features accessible on/through this site) is found to be advisory or a recommendation; and not merely informational in nature, the same is in any event provided with the intention of being for general circulation and availability only. As such it is not intended to and does not form part of any offer or recommendation directed at you specifically, or have any regard to the investment objectives, financial situation or needs of yourself or any other specific person. Before committing to a trade or investment therefore, please seek advice from a financial or other professional adviser regarding the suitability of the product for you and (where available) read the relevant product offer/description documents, including the risk disclosures. If you do not wish to seek such financial advice, please still exercise your mind and consider carefully whether the product is suitable for you because you alone remain responsible for your trading – both gains and losses.

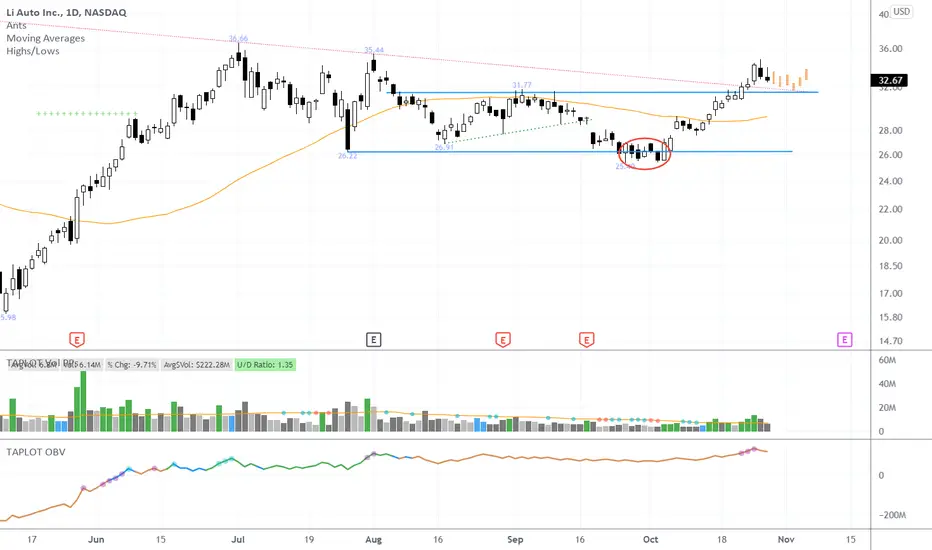
Li-long position I been accumulating li since $20.
Li is exhibiting a decrease in volatility and in volume.

LI small long positionElliott Wave count I’m following:
White = I’m doing a larger degree ABC count
--> Target upside is $58 longer term
Green = Looks like coming off wave (ii) retrace around $27.73. Green count is within White C.
--> Target upside $40; $50
Light Blue = smaller degree count within green wave (iii). Counting that we put in light blue wave “i” and wave “ii” and we are potentially starting a blue wave "iii". This would align with EW theory that wave 3's are most powerful, indicating the strong move potential to get up and over the red down trend resistance line.
--> Target upside $38 for light blue “iii”; potential $45+ for longer term light blue “v”
I’m just in a small, long call spread weeks out. The yellow dotted line represents potential EW count invalidation for light blue below $29. Below $27.73 could be considered as overall invalidation and price movement creating overall different structure

#LI price action is trapped in a range#LI price action is trapped in a range at the end of this range I am starting to see some bearish momentum we could see price action break the bottom of this range and continue to the downside.
NASDAQ:LI

LI: More Pain?It looks like there's more pain on the way come in for LI considering a key Gann angle has been breached and support was also broken. Keeping an eye on this one - Could be a good short opportunity

Li Auto-bullish movementLi Auto bounced really hard back in May, just published Q3 results today, which was better than expected. This could help Li to move up more, first target would be $36.5. On the downside we have support at the trend line and in the $30-$32 dollar zone.
Not financial advice, just my opinion.
Stay green. :)

$LI Still on the watch listI'm still watching $LI
Maybe something like this heading into earning would be ideal.
Nice 5 months base so remains on the watchlist
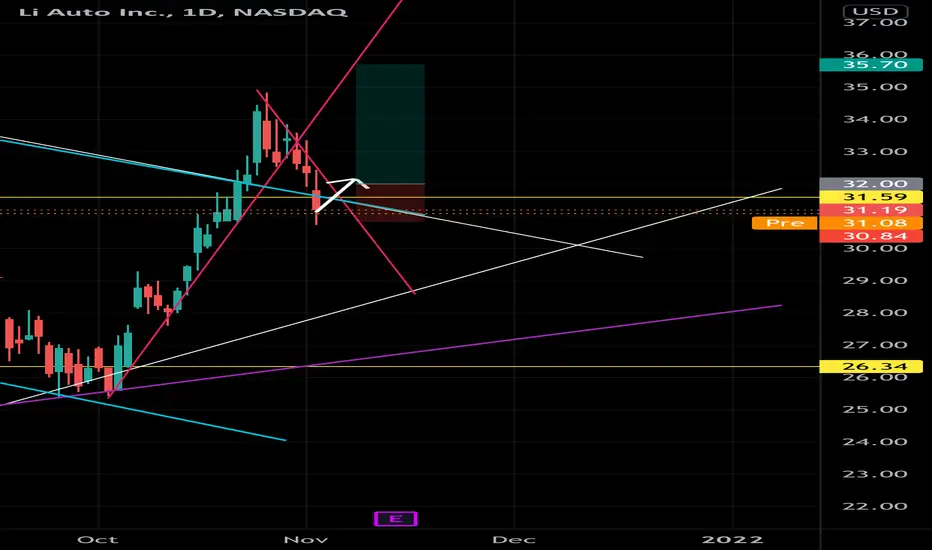
Quick TradeLooking for a fake bullish cross.
Short position with stop at $31.3 / $31.4.
The entry depends on what will happen with the next candles.


This could be our next runnerI entered this today as looks like this one has been behind all the others and there is a great upside available. My target for the swing is $47.

LI nice set up, added to the watchlist 🧐LI providing another dip entry at its trendline support, good risk reward on this dip if you use the trendline as a stop loss
price targets are 32.5/36/47
$LI working on its bullback pivot$LI i like this name and been trying to find a low risk entry to get onboard. Nice base forming & vol pattern
Its been up 4 weeks in a row. I would be very interested if it could pull in to that bo level quietly & start to make a turn. Orange bars is what i would like to see

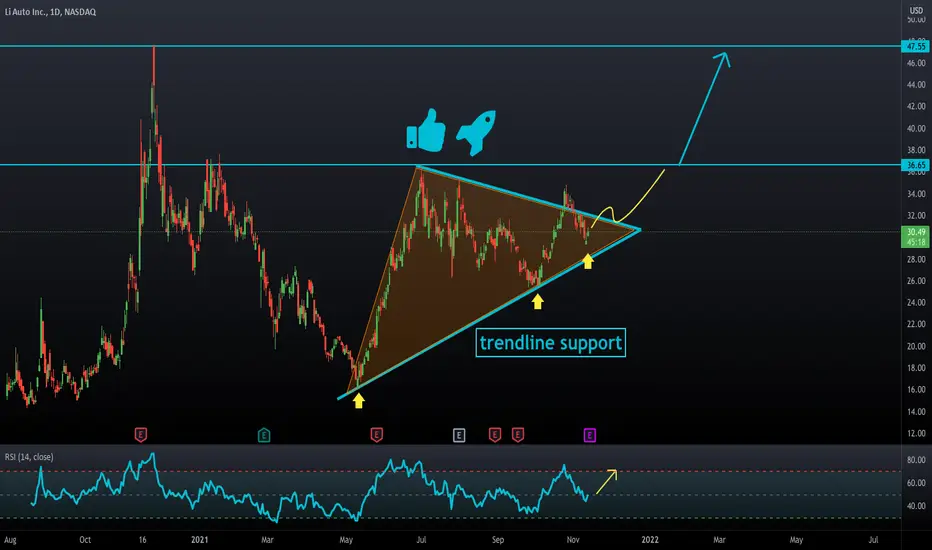
LI Technical Analysis So LI… so many lines, trends, patterns, tbh I kinda like LI’s chart. So what we got, we have very strong trend line since the IPO I think (purple line), we have bullish flag pattern, we have triangle, and we now have channel down. So my play will be right now to wait, patience is the key right now, the smart move will be to wait till the price break up the current down trend that began few days ago(pink line) and to break up the flag, triangle and resistance at 31.59, when this accrue and with some confirmations of indicators I will 100% will take the trade with tight stop loss below the triangle.
Please tell me what you guys think
11/1 - 11/5 watchlist #1 Rationale: Bull flag on the daily and Chinese automakers NIO, LI, and XPEV will post deliveries reports this week

$LI Watch for a Pullback Buy Setup$LI i like this name and been trying to find a low risk entry to get onboard. Nice base forming & vol pattern
Its been up 4 weeks in a row. I would be very interested if it could pull in to that bo level quietly & start to make a turn. Orange bars is what i would like to see.
Li Nice breakout of descending triangle. Clear strong weekly candle. Seems we could get a solid push to upper channel resiatnce

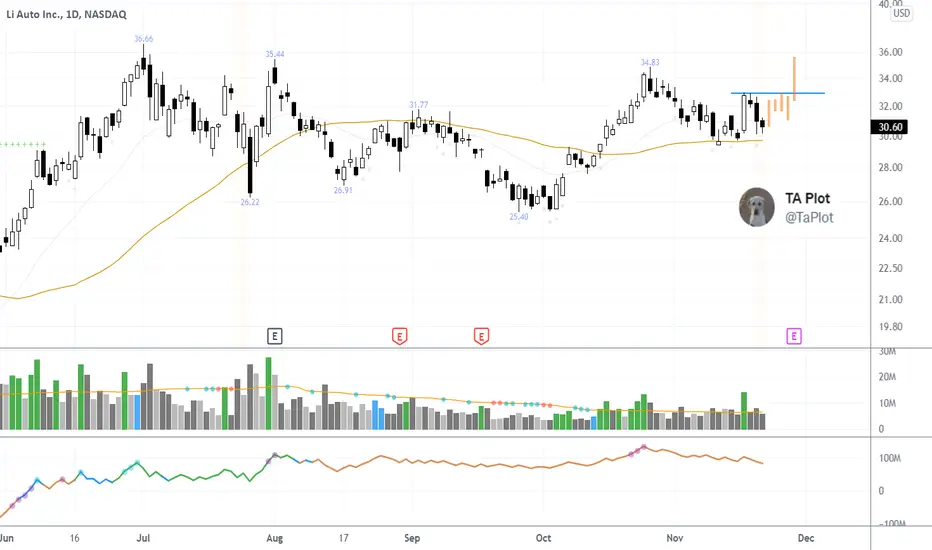
$LI Starting to Come Back$LI is also back after pealing away from the previous shelf it was building and now running up the right side after creating a shakeout (red circle).
watching to see if will give us a low risk entry but it might just blast out and away.

Technical Target for Long Position on LI AUTO INC.THIS IS NOT FINANCIAL ADVICE.
Li Auto is one of the few Chinese Stocks that has continued to show strength despite the overwhelming regulatory pressure being placed on Chinese Companies. With a high of 47.70 and low of 15.98 in the past year, LI has been forming a strong consolidation toward the upside. Price action has gapped above the 200 day MA and continues to approach the 50 day MA.
Fundamentally, Chinese EV stocks are still a worthy long-term play for all investors whom are drawn to sustainability play in emerging markets. Technical Analysis suggests that breaking the bull flag resistance with strong volume will lead to further upside toward a price target of $45, facing some resistance at horizontal resistance of $36.49.

not ready yet, but its setting up for a big rally in my opinion.LI is getting ready for a rally to 35+ once it clears the big resistance around 29-30. watching this one like a hawk in the next couple weeks. but I am neutral for now! good luck ! :)
