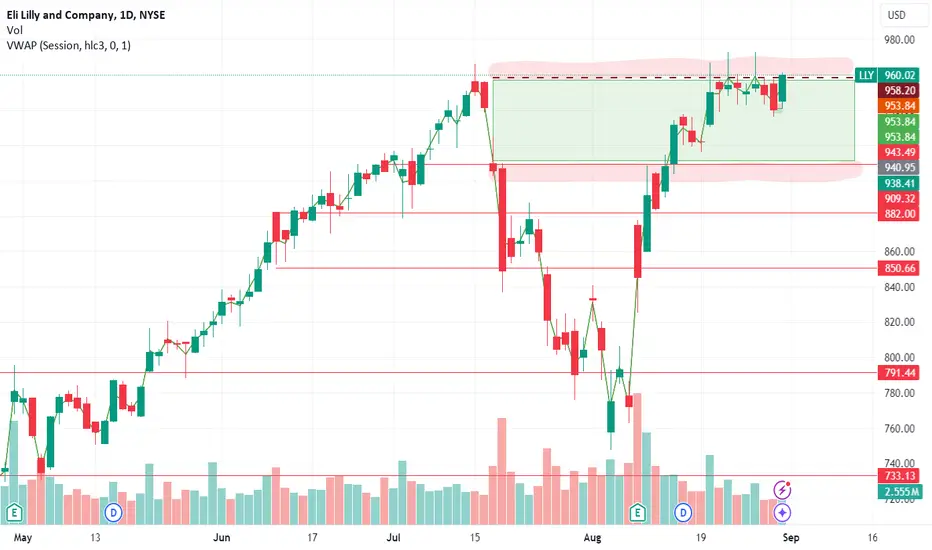
LLY: The Next Support Levels to Watch!On the daily chart, after a strong rally towards the resistance level at $966.10, LLY has experienced a sharp pullback. The stock failed to break through the key resistance and showed a strong rejection at that level, indicating a potential top signal. The bearish momentum is evident as the price is heading toward a possible retracement zone. The Fibonacci retracement levels show key levels to watch, with the 38.2% retracement near $880, and further possible retracements toward 50% at $849 and 61.8% at $825. The 21-day EMA is still trending upwards but is now being tested as the price begins to weaken. If lost, then the retracements will be our next targets.
On the weekly chart, a clear V-shape recovery is visible, which culminated in a significant rise back toward the $966 resistance area. However, the rejection at this level has formed a potential double top, which is often a bearish reversal signal. The price has now pulled back sharply, which aligns with the signals on the daily chart. If the price continues to decline, the $850 area around the 21-week EMA will be critical support levels to monitor, whichc coincides witth the 50% retracement level observed on the daily chart. If the price breaks below these levels, it could indicate a deeper correction is underway.
In conclusion, LLY appears to be in a corrective phase after failing to break through the key resistance at $966. For now, we should keep an eye on the key Fibonacci retracement levels and the 21-EMA for potential support during this pullback. A continued failure to hold these levels could lead to more downside pressure in the short term.
For more detailed technical analyses and insights like this, be sure to follow my account. Your support helps me continue providing valuable content to help you make informed trading decisions.
Remember, real trading is reactive, not predictive, so let's stay focused on the key points described above and only trade when there is confirmation.
“To anticipate the market is to gamble. To be patient and react only when the market gives the signal is to speculate.” — Jesse Lauriston Livermore
All the best,
Nathan.
LLY trade ideas

1027 at the higher level of upper bollingerDaily analysis varies by sentiment and political news. The technicals, however, are close to a squeeze.
Eli Lilly's Zepbound: A Game-Changer for Obesity Treatment?In a groundbreaking move that could redefine the landscape of obesity treatment, Eli Lilly has slashed the price of its weight loss drug, Zepbound, by half. But is this simply a strategic business decision, or is it a beacon of hope for millions struggling with obesity? Join us as we delve into the implications of this bold move and explore the potential impact on the future of weight management.
Imagine a world where obesity is no longer a daunting, insurmountable challenge. A world where effective, affordable treatments are accessible to all who need them. Eli Lilly's recent announcement of a significant price reduction for Zepbound brings us closer to that reality.
By making this groundbreaking decision, Eli Lilly has not only demonstrated its commitment to patient access but has also sent a powerful message to the broader healthcare industry. This move has the potential to disrupt the status quo, challenging the outdated policies and practices that have hindered progress in obesity treatment.
As we explore the implications of Eli Lilly's decision, we must consider the broader context of the obesity epidemic. For decades, obesity has been stigmatized and overlooked as a serious medical condition. Many individuals struggling with weight loss have faced limited treatment options and significant financial burdens.
Eli Lilly's move to lower the price of Zepbound could be a game-changer in this regard. By making the drug more affordable, the company is empowering patients to take control of their health and pursue a healthier lifestyle. This could lead to a significant increase in the number of people seeking treatment for obesity, ultimately improving public health outcomes.
However, it is important to note that this is just one step in a larger journey. While Eli Lilly's decision is undoubtedly a positive development, more needs to be done to address the systemic issues that contribute to the obesity epidemic. Policymakers, healthcare providers, and communities must work together to create a supportive environment that promotes healthy eating, physical activity, and access to affordable, effective treatments.
In conclusion, Eli Lilly's announcement of a price reduction for Zepbound represents a significant milestone in the fight against obesity. By making this drug more accessible, the company is not only helping individuals achieve their weight loss goals but also challenging the broader healthcare system to prioritize obesity treatment.

WATCHLIST 8/25 PART 2AMEX:IWM - Russell 2000 Outshines S&P 500, Nasdaq 100 As Powell Eyes Rate Cuts. Looking to add calls as long as $220 holds for a move towards $225 and higher.
BMV:BRKB - another stock breaking all time highs on Friday. Stock is breaking out on charts. Calls above $455 for a move towards $470. Stock is strong on indicators.
NYSE:LLY - the company announced results showing “it Tirzepatide injections reduced the risk of progression to type 2 diabetes by 94% in adults with pre-diabetes and obesity.” looking for calls above $950 for a move towards MIL:1K and higher
NASDAQ:COIN - another Bitcoin related stock on watch as bitcoin moves higher. Calls added in group for swing. Next resistance at $216.6. More upside above that level.
NYSE:HD - Stock breaking recent highs at $376. Stock is a decent uptrend. Rate cut news should help. Calls above $377 for a move towards $385 and $400. Stock is strong on indicator level.

Golden cross to the top here we go 1000Position accurately, making this close to retracing but not enough room to run as we are close to the end, I would like to see that maximum at 1000+ before I see a reversal. Watching closely.

ELI LILLY Recovered all losses from its High! What's next?Eli Lilly and Company (LLY) posted a miraculous bullish reversal in the past 2 weeks, recovering yesterday all of the losses of the brutal correction since its July 15 All Time High. Having rebounded on its 1D MA200 (orange trend-line) while the 1D RSI touched the 30.00 oversold barrier for the first time since February 28 2023, we can claim that LLY's Channel Up now sets eyes for its next Higher High.
This pattern is best illustrated with the use of the Fibonacci Channel levels. After initially holding the 1.0 Fib as Resistance, the 'ceiling' is now the 1.5 Fib extension, basically has been since September 12 2023.
The interesting parameter of this pattern is that every approximately +35.00 to +40.00% rise, the price pulls back or turns sideways (red arc pattern) until it eventually hits the 1D MA50 (blue trend-line).
As the stock completes a +35% rise from the bottom, a little above the 1000 mark, we expect it to turn sideways at best. The target after that is $1200, exactly on the 1.0 Fibonacci level, which is still a modest one, considering that the ceiling is now the 1.5 Fib extension, as discussed above.
-------------------------------------------------------------------------------
** Please LIKE 👍, FOLLOW ✅, SHARE 🙌 and COMMENT ✍ if you enjoy this idea! Also share your ideas and charts in the comments section below! This is best way to keep it relevant, support us, keep the content here free and allow the idea to reach as many people as possible. **
-------------------------------------------------------------------------------
💸💸💸💸💸💸
👇 👇 👇 👇 👇 👇

#ELI LILLY $LLY back to ATH! What's next for LLY (Long term).Eli Lilly (LLY) stock jumped more than 3% to a record high on Tuesday after clinical trial results showed tirzepatide—the active ingredient in Lilly's injectable weight-loss drug Zepbound and diabetes treatment Mounjaro—lowered patients' risk of developing type 2 diabetes by 94%.
LLY is climbing back toward its record high of 966.10 reached on July 15.
The three-year study of patients with prediabetes and either obesity or overweight also found that those who received tirzepatide lost 22.9% of their body weight on average, compared with 2.1% for patients treated with a placebo.
Eli Lilly shares jumped to an all-time high on Tuesday, bringing their year-to-date return to more than 60%.
This is very bullish news for LLY. This is easily a 1k stock and a good long term investment if you want exposure to the Glucagon-like peptide-1 meds (GLP-1). LLY is number one in that field hands down.
Consensus around 100bn, current 950.
Research material for you:
Alzheimer's potential benefits.
Novo data (NVO), 2025.

upper 800s promising for another reversalThis stock moves a lot and is moving on the upside, but many indicators suggest this could be changing.

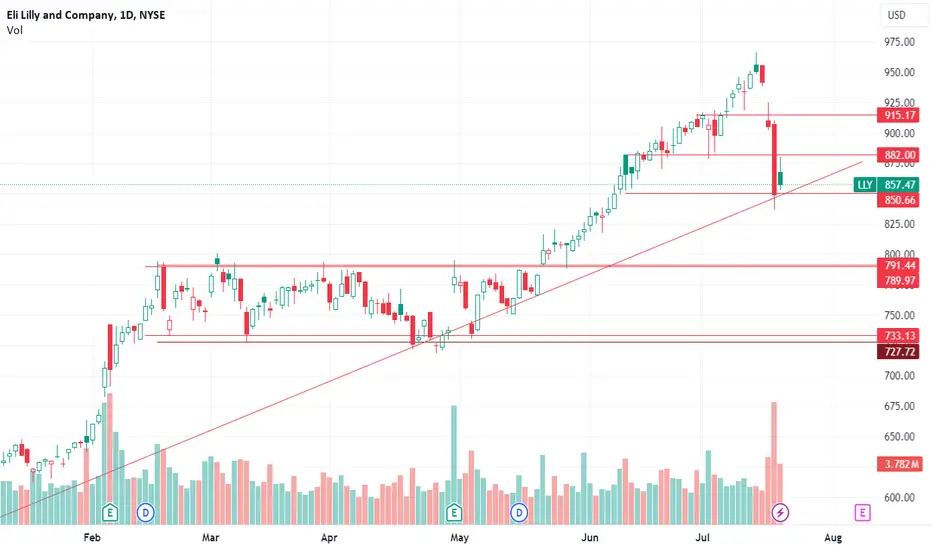
LLY: On The Brink Of CollapseEli Lilly is the one stock I've made the most returns on this year. With it's violent up and down swings, it's exactly what you look for as an options trader. As I've been observing LLY over the last few weeks, I decided to go back in time again to the origins of this monstrous parabolic move and share it with you all. If you look at the smaller time frames, you will see that LLY has filled it's gap target to the upside, but there are so many gaps to the downside. When the market does decide to fall hard, I believe LLY will fall the hardest. Is this not the perfect stock to fit the old adage, "THE BIGGER THEY ARE, THE HARDER THEY FALL?" Once LLY breaks below 747, the next targets are well below the current price. This means BIG returns for options traders. I don't see much more upside for this stock (if any), so the downside potential will play favorably.
PT1 747 PT2 609
Targets are 1 to 2 months.

LLY bullishLLY has bounced off 200 EMA
LLY has a daily candle closed above 50 MA
This confirms the technical bullish bias
and it should now break the previous high .
Positions should be taken now to ride the bullish wave
Stop loss is 708

LLY 1H Long Swing Aggressive trend tradeAggressive trend trade
- short impulse
+ biggest volume T1
+ biggest volume manipulation
Calculated affordable stop limit
1 to 2 R/R take profit after 1/2!!!
Daily context
"+ long impulse
+ 1/2 correction"
Monthly context
"+ long impulse
- neutral zone"
LLY @NYSE
Sell Stop 901.82 LMT 905.94, GTC
Sell Limit 913.63, GTC

Eli Lilly Shares Surge Over 9% After Strong Earnings ReportEli Lilly Shares Surge Over 9% After Strong Earnings Report
As the chart of Eli Lilly's (LLY) share price shows today, yesterday's trading closed at a level more than 9% higher than Wednesday's closing price. The main driver of this growth was a strong Q2 report:
→ Earnings per share: actual = $3.92, expected = $2.74;
→ Gross sales: actual = $11.3 billion, expected = $9.99 billion.
Market participants reacted positively not only to the fact that the American pharmaceutical company's actual results significantly exceeded forecasts but also to Eli Lilly's rising expectations for the second half of the year, driven by demand for its diabetes treatment Mounjaro and weight loss drug Zepbound.
Technical analysis of the Eli Lilly (LLY) stock chart shows that:
→ The price action is forming an upward channel in 2024 (shown in blue);
→ After a rebound, the median line of this channel was breached (as indicated by the arrow);
→ As could be expected, this line acted as resistance – as indicated by the high of yesterday's candlestick.
What is the forecast for Eli Lilly (LLY) shares?
Wall Street analysts surveyed by TipRanks remain positive – none of them recommend selling shares of the company, which has the largest market cap in the healthcare sector at over $800 billion. On average, they forecast that LLY shares will reach $955 within 12 months.
This suggests that the current upward channel may remain relevant. However, it’s possible that:
→ The lower boundary will continue to act as support;
→ The boundaries of the bullish gap formed at yesterday's opening may also provide support. A similar action can be seen on the chart – after a wide bullish gap (also formed following a strong report) on 30 April, LLY shares found support near the lower boundary of that gap around $740.
This article represents the opinion of the Companies operating under the FXOpen brand only. It is not to be construed as an offer, solicitation, or recommendation with respect to products and services provided by the Companies operating under the FXOpen brand, nor is it to be considered financial advice.

Eli Lilly Surges 12% On Strong Earnings Beat and Q2 ReportsEli Lilly & Co. (NYSE: NYSE:LLY ) has once again captured the spotlight with its impressive second-quarter performance in 2024. The pharmaceutical giant’s stock surged by over 12% following the announcement of its quarterly earnings, driven largely by the soaring sales of its diabetes drug Mounjaro and weight loss injection Zepbound.
Blowing Past Expectations
Eli Lilly reported $11.3 billion in revenue and $2.97 billion in net profit for Q2, far exceeding Wall Street’s expectations. Analysts had anticipated $9.97 billion in revenue and $2.48 billion in profit, according to FactSet. The company also reported earnings per share (EPS) of $3.28, significantly higher than the $2.74 forecasted by analysts.
This remarkable performance marks a 36% increase in revenue and a staggering 68% increase in profit compared to the same period last year. In Q2 2023, Lilly had reported $8.31 billion in sales and $1.76 billion in profit.
The pharmaceutical giant’s strong earnings prompted a bullish revision of its full-year guidance. Eli Lilly raised its forecasted EPS for the year to between $16.10 and $16.60, up from its previous guidance of $13.50 to $14 per share. Additionally, the company now expects annual revenue to range between $45.4 billion and $46.6 billion, an increase of $3 billion at both ends of the range.
Mounjaro and Zepbound: The Driving Forces
The extraordinary demand for Lilly’s diabetes and weight loss drugs, Mounjaro and Zepbound, has been the primary catalyst for its Q2 success. Mounjaro, which generated $3.09 billion in revenue during the quarter, saw its sales more than triple from the same period last year. Zepbound, a relatively new entrant to the market, raked in $1.24 billion in sales, far surpassing the $922.2 million that analysts had projected.
The growth in Mounjaro and Zepbound’s sales comes amidst a broader surge in the weight loss drug market, which some analysts estimate could reach $130 billion by the end of the decade. Eli Lilly, along with Danish competitor Novo Nordisk, has established a near-duopoly in this space, though the field is rapidly attracting interest from other pharmaceutical giants and startups.
Navigating Supply Challenges
The extraordinary demand for Mounjaro and Zepbound has led to supply constraints, a challenge that Eli Lilly has been aggressively addressing. The company has invested heavily in expanding its manufacturing capabilities, including building six new plants and hiring thousands of workers. The recent easing of supply issues for both drugs in the U.S. is a testament to these efforts.
Eli Lilly’s CEO, David Ricks, expressed confidence in the company’s ability to meet the growing demand for its products. “We just see unbelievable demand, and we’re not even trying that hard to market this drug,” Ricks told CNBC. He added that the company’s supply chain improvements have been crucial in driving the quarter’s success.
Future Outlook: Beyond Weight Loss
Eli Lilly is not resting on its laurels. The company is actively working to expand its dominance in the weight loss drug market by developing new treatments and exploring additional uses for its existing drugs. Two promising candidates are in late-stage clinical trials: orfoglipron, an oral weight loss pill, and retatrutide, a hormone-mimicking injection. Results for orfoglipron are expected next year, while retatrutide’s results are anticipated in 2026.
Furthermore, Lilly is exploring new indications for its drugs, such as using Zepbound to treat sleep apnea. If successful, this could further bolster Lilly’s market position and open new revenue streams.
Market Reaction and Investor Confidence
Eli Lilly’s robust earnings report and optimistic outlook have led to a surge in investor confidence. The company’s shares jumped 10% during premarket trading following the earnings announcement, and they have continued to climb, reflecting the market’s positive reception.
With a market capitalization of over $730 billion, Eli Lilly (NYSE: NYSE:LLY ) is now the largest pharmaceutical company in the U.S. The company’s stock has risen more than 30% this year, building on a nearly 60% increase in 2023. This growth underscores investor confidence in the long-term potential of Lilly’s drug pipeline and its ability to navigate the challenges of a highly competitive market.
Conclusion
Eli Lilly’s Q2 2024 earnings report highlights the company’s strong market position and its ability to capitalize on the booming demand for diabetes and weight loss treatments. With a robust pipeline, aggressive expansion plans, and a clear focus on innovation, Eli Lilly is well-positioned to maintain its leadership in the pharmaceutical industry for years to come. As the company continues to develop new drugs and expand its market reach, investors and industry observers alike will be watching closely to see how Lilly navigates the evolving landscape.

Could rock the earning world!A few key points to note are that the support has played a significant resistance since the YTD crossover of higher EMA still shows signs of bear territory, but I also see a major component by playing out above the shade and may consolidate, but if the price action is anything to judge this by then we could be in for a volatile run until I see some sort of reversal in effect. Definitely one to watch.

Is Eli Lilly's Stock in a Bubble or just a Correction?Eli Lilly & Co. (NYSE: NYSE:LLY ) has been a standout performer in the stock market this year, with its stock price surging by around 50%, far outperforming the S&P 500’s 15% rise. This impressive performance has brought the stock to trade at 63 times its projected 2024 earnings of $13.75 per share. This raises a critical question for investors: Is Eli Lilly's stock overvalued, or is there still room for growth?
Stellar Growth Driven by Innovative Drugs
Eli Lilly's recent surge can be attributed primarily to the high demand for its obesity drug, Zepbound, and its diabetes drug, Mounjaro. These two drugs alone are expected to bring in $50 billion in annual peak sales. The company is currently facing a shortage of Zepbound and plans to invest $9 billion in a new manufacturing facility to meet this demand.
Additionally, Eli Lilly’s pipeline is extensive, with several drugs under clinical trials across various therapeutic areas. One notable approval is Donanemab, an Alzheimer's Disease treatment, which could generate $5 billion in peak sales. Other successful drugs, such as Verzenio and Zyprexa, also contribute to the company’s robust revenue growth.
Financial Performance and Future Projections
Eli Lilly's revenue is projected to grow from $34 billion in 2023 to over $60 billion by 2026, representing an increase of over 75%. The company's earnings are also expected to more than triple during this period. Despite a 12% decline in net income from $6.2 billion in 2020 to $5.2 billion in 2023, mainly due to increased non-operating expenses and acquisitions, the adjusted net income margin is poised for a rebound.
In Q1 2024, Eli Lilly ( NYSE:LLY ) reported an adjusted net margin of 26.6%, up over 500 basis points year-over-year. The company’s investments in R&D and product development are starting to pay off, and adjusted earnings are expected to range between $13.50 and $14.00 per share in 2024, more than double the previous year.
Considering these projections and expected margin expansions, Eli Lilly’s adjusted EPS could reach $25 by 2027. If the stock price remains constant, the forward P/E multiple would decrease to 34x in 2026. However, investors are betting on the stock price increasing, resulting in a more modest P/E contraction to about 52x. This scenario would imply a 50% growth in Eli Lilly's stock price to approximately $1,300 over the next three years.
Risks and Competition
Despite the positive outlook, Eli Lilly faces risks, particularly from increasing competition in the obesity drug market. Competitors like Novo Nordisk, Roche, and Amgen are also making strides in weight-loss treatments. However, the obesity drugs market is projected to grow 16-fold to over $100 billion by 2030, with Eli Lilly and Novo Nordisk likely dominating this space.
Is Eli Lilly's Stock in a Bubble?
The term "bubble" implies a scenario where asset prices are inflated beyond their intrinsic value, often driven by speculation and a belief that prices will never fall. While Eli Lilly’s stock has seen tremendous gains, rising 656% over the past five years compared to the S&P 500’s 78.4% increase, it does not necessarily mean it is in a bubble. Eli Lilly’s rise is backed by strong fundamentals, significant revenue growth, and promising developments in its drug pipeline.
Conclusion
Eli Lilly’s stock is not just a result of speculative trading; it is supported by solid business performance and growth prospects. While there are competitive risks, the company’s innovative drug portfolio and strategic investments position it well for continued success. Any dip in Eli Lilly’s stock should be seen as a potential investment opportunity, offering robust long-term gains. The next few years will likely see Eli Lilly continue its upward trajectory, driven by market share gains and regulatory approvals.

LLY headed lower?NYSE:LLY LLY looks like it will head lower. Support at the dotted lines on the composite index have marked bottoms, but failure has seen continuation. We have a break below the BB and LMACD roll over.
~784 and ~808 align to AVWAPs anchored to gaps and fib confluences. ~784 aligns with support on the volume profile.

reversal back to 900It looks like selling pressure is easing a little for some bullish fightback after tech took a chunk out of the sector. It looks like the dust has settled.

The First Trillion Dollar Healthcare Company - Eli LillyI recently wrote about Eli Lilly and why it has caught my attention, what it may mean for markets, but more specifically the most expensive and elaborate industry on Earth, that none of us can understand... HEALTHCARE.
Insurance is wildly expensive.
Many people are focused on health.
Scientists around the planet are trying to solve health.
And now, Eli Lilly, is on the very of becoming the first trillion dollar company in healthcare. Eli Lilly is nearing $900 billion market cap and is on pace to become the first trillion dollar healthcare company.
I have long followed healthcare stocks because I do believe they bring a lot of insight into health, innovation, and the natural sciences. After all, they are tasked with curing challenging diseases, sicknesses, and other aspects to help humans. Most recently, a certain stock has caught my attention.
I find this to be a noteworthy development for the industry, especially while stocks like Pfizer and others, such as NASDAQ:MRNA are dropping. NYSE:PFE
Place your bets accordingly. This move and alert has been added to my watchlist.

LLY: Is the Ride up over?LLY is showing overbought on the weekly with the RSI and candle Bollinger bands curving to the downside this week. The upside target is 933 and two downside targets of 893 and 851.

935 next, it has proven it's here to stayPoised to go higher and then maybe a split, as that is the direction it is headed. I expect to see more positive news and higher expectations for a major drug breakthrough and the chart just hasn't had enough of it.

LLY Potential buy setupReasons for bullish bias:
- Entry is at breakout of HH
- DOW theory, SL at last HL
- Respecting trendline
Entry Level: 655.60
Stop Loss Level: 565.08
Take Profit Level 1: 746.12

Eli Lilly's Alzheimer's drug Kisunla wins FDA approvalEli Lilly & Co.'s new Alzheimer's disease drug, Kisunla, has received approval from the US Food and Drug Administration (FDA), marking a significant advancement in treating the disease. This approval positions Kisunla as the second drug available that can slow the progression of Alzheimer's, a condition affecting around 6 million Americans.
Kisunla's journey to market has been fraught with regulatory hurdles, including the FDA's initial reluctance to fast-track the drug based on early trial results, preferring instead to review late-stage data. This thorough scrutiny culminated in a one-day hearing earlier this year to deliberate on Kisunla's safety and efficacy, eventually leading to its approval. Kisunla will now compete with Eisai Co.'s Leqembi, which has been available in the US since early 2023.
Technical analysis of Eli Lilly & Co. (NYSE: LLY)
Exploring potential trading opportunities, let us review the technical aspects of Eli Lilly's stock:
Timeframe: Daily (D1)
Current trend: there is an observable uptrend, though the stock has recently broken the support level at 905.00 USD and is attempting to consolidate below it
Resistance level: 917.00 USD
New support level: after breaking 905.00 USD, further confirmation is necessary to establish new support
Potential downtrend target: if a downtrend is established, the downside target could be around 820.00 USD
Short-term target: if the uptrend resumes and the stock price breaks through the resistance at 917.00 USD, a short-term target could be set at 940.00 USD
Medium-term target: should the upward momentum be sustained, the price might rise to 960.00 USD
Investors should closely monitor Eli Lilly’s performance, especially in light of the recent FDA approval of Kisunla. This development could significantly impact the company's market position and stock performance in the pharmaceutical sector.
—
Ideas and other content presented on this page should not be considered as guidance for trading or an investment advice. RoboMarkets bears no responsibility for trading results based on trading opinions described in these analytical reviews.
The material presented and the information contained herein is for information purposes only and in no way should be considered as the provision of investment advice for the purposes of Investment Firms Law L. 87(I)/2017 of the Republic of Cyprus or any other form of personal advice or recommendation, which relates to certain types of transactions with certain types of financial instruments.
Risk Warning: CFDs are complex instruments and come with a high risk of losing money rapidly due to leverage. 69.88% of retail investor accounts lose money when trading CFDs with this provider. You should consider whether you understand how CFDs work and whether you can afford to take the high risk of losing your money.
