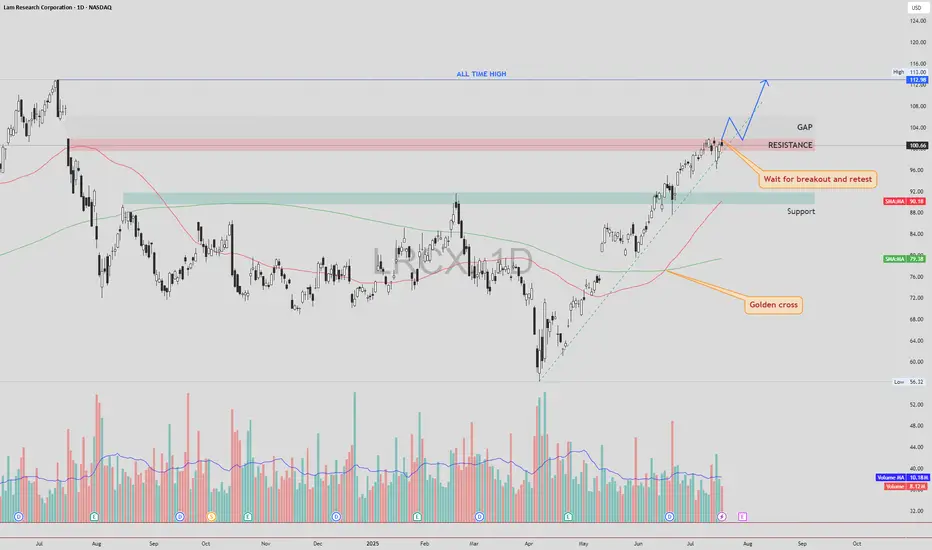
LRCX – Gap Fill First, Then Retest and Potential Move to ATHLRCX NASDAQ:LRCX is currently trading just below a key resistance zone, supported by strong bullish momentum and a confirmed Golden Cross formation.
🔍 Technical Scenario
There is a high probability that price may fill the gap above without retesting the current resistance. After the gap is filled, we could see a pullback to retest the previously untouched resistance zone (now acting as support).
If this retest is successful and holds, the structure may support a continuation move toward the All-Time High (ATH) zone.
📌 Trade Plan
Entry: Avoid chasing the breakout candle. Wait for a gap fill, followed by a clean retest of the broken resistance zone. Enter on confirmation of support holding.
Stop Loss: Place SL just below the retest zone or under the most recent higher low (structure-based stop).
Target 1: Gap fill completion
Target 2 : All-Time High (ATH), if retest confirms
⚠️ Risk Management
The gap-fill rally without retest can be volatile. Patience is key — let the price come back and confirm the breakout zone as new support.
As always, DYOR and manage your position sizing based on your risk profile.
LRCX trade ideas
LRCX watch $71.06-71.37: proven Fib Zone to Pump or DumpLRCX trying to recover along with the semis overall.
Currently testing a well proven zone at $71.06-71.37
Bulls want to push immediately without any dip here.

Lam Research May Be Done ConsolidatingLam Research rallied sharply in late April and early May. Now, after a period of consolidation, some traders may expect a breakout.
The first pattern on today’s chart is the bullish price gap on May 12 after Treasury Secretary Scott Bessent lowered tariffs on China. LRCX spent the next two weeks in a range between $79.78 and $86.04, while holding above its March high. Did new support form above old resistance?
The maker of chip equipment established itself above the 200-day simple moving average (SMA) in the process. The 200-day SMA is also turning positive. Those signals may be consistent with longer-term bullishness.
Next, the 8-day exponential moving average (EMA) is above the 21-day EMA and MACD is rising. Those signals may be consistent with shorter-term bullishness.
Check out TradingView's The Leap competition sponsored by TradeStation.
TradeStation has, for decades, advanced the trading industry, providing access to stocks, options and futures. If you're born to trade, we could be for you. See our Overview for more.
Past performance, whether actual or indicated by historical tests of strategies, is no guarantee of future performance or success. There is a possibility that you may sustain a loss equal to or greater than your entire investment regardless of which asset class you trade (equities, options or futures); therefore, you should not invest or risk money that you cannot afford to lose. Online trading is not suitable for all investors. View the document titled Characteristics and Risks of Standardized Options at www.TradeStation.com . Before trading any asset class, customers must read the relevant risk disclosure statements on www.TradeStation.com . System access and trade placement and execution may be delayed or fail due to market volatility and volume, quote delays, system and software errors, Internet traffic, outages and other factors.
Securities and futures trading is offered to self-directed customers by TradeStation Securities, Inc., a broker-dealer registered with the Securities and Exchange Commission and a futures commission merchant licensed with the Commodity Futures Trading Commission). TradeStation Securities is a member of the Financial Industry Regulatory Authority, the National Futures Association, and a number of exchanges.
TradeStation Securities, Inc. and TradeStation Technologies, Inc. are each wholly owned subsidiaries of TradeStation Group, Inc., both operating, and providing products and services, under the TradeStation brand and trademark. When applying for, or purchasing, accounts, subscriptions, products and services, it is important that you know which company you will be dealing with. Visit www.TradeStation.com for further important information explaining what this means.


Recovery or Rejection for $LRCX?🚨 Recovery or Rejection for NASDAQ:LRCX ?
Lam Research is up 10%+ on strong earnings & guidance—but it’s testing a key S/R zone!
🔹 Bullish above $76.70—watch for momentum 🚀
🔹 Bearish if rejected—potential pullback 📉
Big move incoming—what’s your read? 👀

$LRCX $55 targetDownside market, another semi that will go down too. Target is an area of support.
WSL

Lam Research to the Upside. LRCXWe are (probably) bouncing off the resistance. That bullish engulfing, VZO cross, Stoch cross, BB%PCT divergent, candlestick cross on vWAP and US are evidence of the bullish stance on this one. Whatever your system is, be prepared to look at the market from multiple directions. I normally use a constellation of five, but usually more, factors to develop an opinion on trend, market structure, points of entry and exits.

AI infrastructure investmentsLam Research is one of the companies that should benefit the most from the US 500 billion infrastructure investments.

Lam Research Pushes HigherLam Research has consolidated after dropping in July, but now traders may think the chip-equipment stock is coming back to life.
The first pattern on today’s chart is the weekly close of $84.74 from August 23. LRCX tried to break that level in September and October without success. But the stock closed above it yesterday as the broader Nasdaq-100 climbed. Is it finally breaking out?
Interestingly, the 200-day simple moving average is in the same approximate location. The stock additionally closed above it for the first time since last summer.
Next is the rounded basing pattern around an earlier peak from July 2023. That may suggest old resistance has become new support.
Finally, MACD is rising. The 8-day exponential moving average (EMA) is also above the 21-day EMA. Those patterns could indicate a bullish short-term trend.
TradeStation has, for decades, advanced the trading industry, providing access to stocks, options and futures. If you're born to trade, we could be for you. See our Overview for more.
Past performance, whether actual or indicated by historical tests of strategies, is no guarantee of future performance or success. There is a possibility that you may sustain a loss equal to or greater than your entire investment regardless of which asset class you trade (equities, options or futures); therefore, you should not invest or risk money that you cannot afford to lose. Online trading is not suitable for all investors. View the document titled Characteristics and Risks of Standardized Options at www.TradeStation.com . Before trading any asset class, customers must read the relevant risk disclosure statements on www.TradeStation.com . System access and trade placement and execution may be delayed or fail due to market volatility and volume, quote delays, system and software errors, Internet traffic, outages and other factors.
Securities and futures trading is offered to self-directed customers by TradeStation Securities, Inc., a broker-dealer registered with the Securities and Exchange Commission and a futures commission merchant licensed with the Commodity Futures Trading Commission). TradeStation Securities is a member of the Financial Industry Regulatory Authority, the National Futures Association, and a number of exchanges.
TradeStation Securities, Inc. and TradeStation Technologies, Inc. are each wholly owned subsidiaries of TradeStation Group, Inc., both operating, and providing products and services, under the TradeStation brand and trademark. When applying for, or purchasing, accounts, subscriptions, products and services, it is important that you know which company you will be dealing with. Visit www.TradeStation.com for further important information explaining what this means.

1/29/25 - $lrcx - Probs a buy, but muh hands full rn1/29/25 :: VROCKSTAR :: NASDAQ:LRCX
Probs a buy, but muh hands full rn
- for low teens (revenue and profit) growth, 5% yields, right zip code (though that's a bit debatable in the immediate - and i mean immediate-term).
- put it on my radar for tonight's EPS in case msft, meta or now screw the pooch and the results are good we can dip buy
- my guess if they beat, stock up, but bc i'm less famiilar i'm just watching for now
- gl to all!
V

Preparing for the next targetsLRCX I think good stock now for buy
Targets : red & blue levels
Good luck & have a great hunting brother

Stock Of The Day / 01.16.25 / LRCX01.16.2025 / NASDAQ:LRCX #LRCX
Fundamentals. Positive news background in the semiconductor chip manufacturing sector.
Technical analysis.
Daily chart: Exit upwards from a wide range with the upper limit of 79.36, formed on October 25, 2024 and confirmed by several touches of the level.
Premarket: Gap Up on moderate volume.
Trading session: The price formed a tightening to the level 79.36 after the opening of the session. We consider a long trade to continue the upward movement when the tightening is formed along the trend.
Trading scenario: breakout (tightening) of the level 79.36
Entry: 79.67 after the breakout and retest. A more conservative entry is possible at the exit upwards from the trade range above the level.
Stop: 79.31, we hide it below the level 79.36.
Exit: Close part of the position at 82.15 when a trading range forms under the level of 82.50 and an unsuccessful attempt to break through it. Close the remaining part of the position at a price of 81.79 when the structure of the uptrend is broken.
Risk Rewards: 1/6
P.S. In order to understand the idea of the Stock Of The Day analysis, please read the following information .

LRCX Resistance Flip?This is such a good looking chart if we manage to break above 80
We might see this name pushing to 90 quick.
Adding this to my watchlist

$lrcxLaggered in the stock market with a technical set up looking like itll break out of 80 range once above may just break out heavily has a
Bullish inverse h&s
Bull flag ing and at point about to break
Once above 79 believe 80 and 85 will target next

$LRCX with a bullish outlook following its earnings #StocksThe PEAD projected a bullish outlook for NASDAQ:LRCX after a positive over reaction following its earnings release placing the stock in drift A with an expected accuracy of 64.29%.

LCRX RETURNS TO THE SEEN OF THE CRIMENASDAQ:LRCX returning to the seen of the CRIME! ☕️
LCRX is retesting the Cup N Handle BREAKOUT FROM 2023! 🤯
LRCX has already tested and bounced off of its Cup n Handle breakout from 2023 twice and is forming the right shoulder of a shorter-term inverse H&S pattern!
Will it bounce again?! Drop a comment below.
The risk/reward ratio on this one is crazy good, IMO! It's going to take something drastic for that CupnHandle breakout support to bust!
My Short Term PT for this chart is: 🎯$80
My Long Term PT for this chart is: 🎯$107
Not financial advice! 🖖

Easy 2.58x R:R LONG Trade on Lam ResearchBuying the bottom of the rangebound channel, which also coincides with 0.382 fib level
Easy swing for 2.58 R:R TP @ $87
Looking forward to positive earnings on 23/10 as well

LRCX - ready for a launchLRCX is compressed and tight here. Probably I would jump here with size but a small starter position would be fine IMO.
Once wave 1 gives confirmation and wave 2 completes , good for going heavy.
Long between 78-83
Stop loss - 75
Target 1 - 92
Target 2 - 100-102
Target 3 - 112

New long term position LRCXAfter careful consideration I have added a new stock to my long-term fidelity account. I am very picky about what I allow into this account. I have started a position in Lam research on this basing of the 100 EMA. I note a rising stochastic RSI on the weekly and a pickup of volume. Given that this market is cyclical, I believe this entrance point is poised for strong gains over the coming few years. Looking back at revenue cycles the stock usually has a moderate red year followed by multiple years of huge growth. Similar to my other energy plays, I believe this is a next level play on the fact that the market overhypes GPU makers. Lam is a play on memory chips, they also have a strong service segment. Memory will need to expand exponentially in order for energy and Ai to expand, this is my thesis. I have been waiting to add semiconductor exposure to my investment portfolio but I have been wanting to avoid egregiously overpriced hot stocks like NVDA etc. I believe this correction is an opportunity for me to expand my portfolio a bit.

LRCX Inverse H&S Forming! Huge move upward inbound! NASDAQ:LRCX Inverse H&S Forming! Huge move upward inbound!
A break of the neckline would reward a 25% upside to the volume gap!

LRCX in the same position and price AMAT was this time last yearLRCX following in the foot steps of AMAT to $295? AMAT also repeating the same move it made a year ago right now as well. Both are in the same field both are involved in the production of Ai processors and the tools to make them. I think its ironic that LRCX just happens to be in the same pattern on the same month AMAT started its nose bleed run up.
Option shares right now are expensive for a $74 stock no matter how long or short you look. Somethings going on and the companies in the semiconductor industry know it. Nvidia and AMD prices right now are very inviting which means they had to reduce their prices either by splitting them or something but they must know that a boom is about to happen and they needed to make their prices in line with what is about to happen. I haven't looked at stock options in over a year and I was surprised to see everyones prices had gone up. Yet Semiconductors all seem to be price point. With the materials side looking Bullish as hell. I am just saying keep your eyes open on this because its about to happen all over the place.....a shift a huge shift.
by iCantw84it
10.16.24

Investment Opportunity in Lam ResearchHello,
With the increasing spotlight on semiconductor companies, particularly giants like Nvidia, many investors are closely tracking the sector's performance. As the AI revolution continues to unfold, identifying companies that have lagged in price, yet hold strong potential, could present significant opportunities. One such company is Lam Research Corp. , a prominent player in the semiconductor space.
About Lam Research:
Lam Research designs, manufactures, markets, and refurbishes semiconductor processing equipment used in the fabrication of integrated circuits. Despite flying under the radar compared to some of its peers, it offers a compelling case for investment.
Here are some key metrics that highlight its strong financial position:
- Market Cap : Approximately $99.6 billion
- Basic EPS : $2.91
- 2024 Revenues : $14.9 billion, with net revenues growing steadily to $3.83 billion
- Share Buybacks : The company has consistently repurchased its shares over the past five years, contributing to shareholder value by avoiding dilution.
- Total Cash : $5.85 billion, with total current liabilities at $4.34 billion, demonstrating a healthy liquidity position and the ability to cover short-term obligations.
- Book Value Per Share : $65. With the current share price hovering near this figure, the stock could be undervalued, making this an attractive entry point.
Technical Perspective:
From a technical analysis standpoint, Lam Research has recently experienced a pullback, presenting a potentially ideal buying opportunity. Our target price for this stock is **$110 per share**.
We strongly recommend considering this stock for your portfolio.
Good luck!

Target 814.12Following daily chart and got a long signal.
TP 814.12, which is first fibonacci level which is enough, expecting around 6% gain.
SL Close under 729
