A reasonable path for MARA to get too 100On the back of the crypto run I think the miner stocks have some good plays as well, especially those with options.
MARA trade ideas


Marathon Digital Holding - MARA - Stock with a Crypto Flare!Marathon Digital Holding - MARA - Stock with a Crypto Flare! Many times this stock, MARA, follows the price movement of major cryptocurrencies such as Bitcoin(BTC). From a Technical Perspective MARA has bounced off the fibonacci golden zone and may project to the 27.2 or 61.8 projections. Edutainment Purposes Only!

$MARA Marathon Digital Trade setup
Hopefully you find the chart helpful in terms of Supports & Resistance etc.
we refrain from adding commentary on the chart as that is reserved for our members and we are very conscious of not giving financial or trading advice.
Thank you for taking time to consult our chart and we would really appreciate a like, follow or comment.


MARA looking like Angelina Jolie from 200720% gap between BTCUSD nav performance and MARA. I believe that gap will close.
So she's looking fine as hell, a beaut.
Partnership with Beowolf should yield a 38% decline in electricity/power costs.
I believe MARA is going to be the winner out of the pack of bitcoin miners because they have been reinvesting in efficiency and growth heavily.
Their sales per employee are nearly double that of RIOT showing that they can do more with less, and if you can stomach no P/E for a decent period of time, their major investments in growth will pay off in the long run versus appearing profitable in the short-term.

Buy MARA 15/9/2021Stock above EXMA 200 and still in uptrend Stock is making higher low and tests the EXMA 13 and EXMA 34 So you can buy target 52.09 stop loss 30.08 Good luck

$MARA 6 Months Base Setting UpLarge 6 Months base on $MARA
Put a little cheat area around its 50 MA back in early august on broke out
Tested $30 level twice w/ buyers stepping back in
Another shelf around $37 last month & moved out on Wed & holding for 3 tight days
Very constructive action. I like it

Marathon Head and shoulders reinterpretedThe Head and shoulders i thought was denied could actually still be forming, this means that MARA isn't out of harms way. However i also see a big wedge forming with potential of sending the price upto test earlier high resistances. With bitcoin being over 50k. i can't see why MARA should drop back down to around 20, however i will be keeping an eye out for the bottom of the wedge as potential alert for me to sell the stock for now.
Follow up post as part of my response to @mbelasy

MARA to $260MARA is showing a lot of promise.
There is a striking resemblance to a previous pullback that made big moves up and I expect a similar (maybe not as high) pump up within the next couple of months.
The resemblance is uncanny and it looks like it has been taking twice as long as before. This puts a peak for MARA at around $260 come late December early February 2022.
I am in with more investment than I probably should but I catch big moves like this once in a blue moon so why not?
Stop loss is below $30

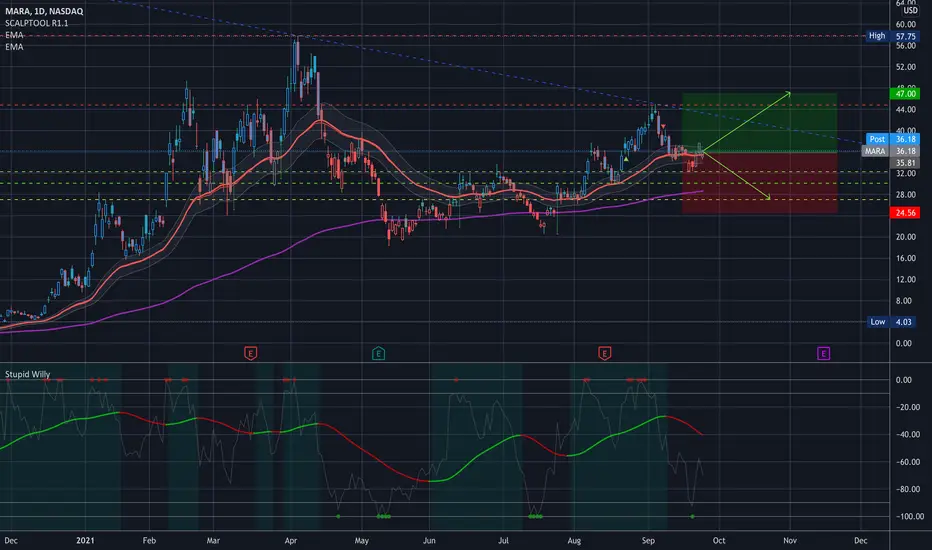
MARA Balance LevelsNASDAQ:MARA
Buy order flow comes in and hit 38.55.
Lets see more acceptance at 38.55.
For those already long, trim at 42.80 or 47.43.

BTBT small little pennant flag and back off it goes Hit me up if you want any robo traders to find these setup automatically for you!! codestlouis.com

Mara double bottom nice double bottom pattern on $MARA, watch for a confirmation of breakout before entry here. should follow bitcoin if it continues to rally. good luck!


Floor for $MARARecent news of banning bitcoin has seemed to tank the price, but this time for $MARA we have reached the low at $32 give or take. I see if we hold this position $MARA can shoot up. However, we do need to see much-needed resistance at this range. Time will tell, good news today with Powell stating that he does not intend to ban bitcoin which people including myself have been worried about for a while. I don't see the infrastructure bill if it passes to have any impact on bitcoin either. A government shutdown however could see a large price spike in $MARA and bitcoin. For now I am neutral, but I could see a spike in price if we can hold resistance.

MARA - Head and ShouldersKeep an eye on this pattern as it develops, as BTC is also at a key level of support.
This coupled with a rising 10yr yield and the SP500 looking a little top heavy would lead me to take the view that limiting unnecessary exposure could be beneficial.
-TradingEdge

$MARA - Key Levels and Analysis - update $MARA - Key Levels and Analysis - update
—————
OK… well, that was fun.
I zoomed into the 4 hour chart just to be able to see what was going on in after-hours… it bounced a little bit at support but nothing definitive.
MARA is at a support level here, after blasting through the one above it from my last post.
I have not added yet, but if it gets to 27 I will
I DO see the head and shoulders and I’m watching carefully… MARA runs more along with digital currency so the patterns don’t mean too much for me in this case…
——————
I am not your financial advisor, but I will happily answer questions and analyze to the best of my ability but ultimately the risk is on you.
My average is in Grey
Red = Resistance
Green = Support
Blue = trendlines
Have fun, y’all!!

Marathon Head and shouldersI am seeing a head and shoulders pattern forming which could send marathon down to support in around 20 dollars if neckline is broken.

$MARA - Key Levels and Analysis $MARA - Key Levels and Analysis
—————
I am still leaning to the bearish side here, while crypto technicals cool off a little bit - and I’d love to be able to add at 27.
Still above the MacD centerline so could go either way…
——————
I am not your financial advisor, but I will happily answer questions and analyze to the best of my ability but ultimately the risk is on you.
Red = Resistance
Green = Support
Blue = trendlines
Have fun, y’all!!
THE Confirmation For New Bitcoin All-Time HighsBitcoin is being difficult as always. Yet, despite its sudden twists and turns, we've called every major reversal thus far since the April peak.
Naturally, technical analysis is all based on probabilities. We don't KNOW where the price is going. The best thing we can do is to produce the most likely case and then add onto it as more pieces of the technical puzzle are being laid in our favor.
Now, is Bitcoin bound for the low $20 000s to complete its high likelihood zigzag? ...
... Is it range bound here for some time to follow? ...
... or is it ready for new all-time highs?
Normally, these are simple questions with difficult answers - that is, difficult if you restrict yourself to the Bitcoin chart only.
What then do I mean by that? Well, lo and behold, for I hereby present to you technical proof of when we can know for certain whether Bitcoin is ready for new all-time highs. Here's how ...
Marathon Digital Holdings, Riot and Hut 8 are all Bitcoin mining companies, whose respective stock developments are in direct relation to that of Bitcoin's spot price. We will therefore take a look at Marathon versus that of Bitcoin!
To access this chart, please enter: NASDAQ:MARA/BITSTAMP:BTCUSD in the search box up to your left.
Literally, what this shows is the internal strength relations between the Marathon stock and Bitcoin's spot price.
This chart is on the weekly:
What first meets the eye is a big reversed head and shoulders formation at which we've been rejected no less than four times by the neck line.
On top of that, we have a clear sideways range of which the upper resistance is the same as the H&S neck line.
Now, if you were to have bought Marathon instead of Bitcoin in April last year, you would have had 1 650% more profits. That's how significantly Marathon has rallied amidst Bitcoin's bullish run.
But what then is the deal with all of this? Reversed head and shoulders, a sideways range ... sure, we get it! Now what?
At first glance this may seem irrelevant. But once we dig deep, it in fact holds all the answers we need.
If Bitcoin were to begin trending in a truly bullish fashion, we can safely expect Marathon to vastly outperform Bitcoin's spot price. This would mean that we'd eventually see a technical outbreak both from the sideways range AND the reversed head and shoulders pattern. And given how strong this level of resistance has been historically (and equally so as support at the very beginning) we can expect a violent move once the price breaks! For the more times a support or resistance is being tested, the stronger a reaction is to be technically expected.
Given that Marathon won't rally unless Bitcoin does, and given the pent up powers that will be released upon a technical breakout between Marathon versus Bitcoin, unless it results in a fakeout, we can safely anticipate Marathon to outperform that of Bitcoin by around 280-350%.
This means that if Bitcoin were to quadruple from here, as in reaching $170 000, we can expect Marathon to ultimately amount to $500-600.
If, on the other hand, Bitcoin were to roll over and lose its bulls versus bears gatekeeper support between $41,000-42,700 (as discussed in detail previously here on TradingView) then we can safely expect Marathon to further under perform versus that of Bitcoin. In such case, a retest of the diagonal line would be a likely indication of Bitcoin having bottomed out. This would be THE ideal place to ladder in longs. If that diagonal support were to break, then the next level of support is the horizontal one, at a -50% under performance for Marathon. If that one breaks, then we have a long standing bear market on our hands.
I will base every Bitcoin decision from here on on this very chart.
I hope this has helped you bring full clarity to Bitcoin and how and when we'll know whether it's ready for new all-time highs.
All the best,
LLT

$MARA #Call #Put #Spread #Straddle #Strangle Mara consolidation looking ready to break.
Play we entered:
Expiry: 09/24/2021
Call: $34 @ $0.77 per
Put: $33 @ $0.96 per

marai think this shit is going down, btc too looks like in downtrend, since mara is a big holder of btc it's balancesheet will be influenced

MARA Daily TimeframeSNIPER STRATEGY (new version)
It works ALMOST ON ANY CHART.
It produces Weak, Medium and Strong signals based on consisting elements.
NOT ALL TARGETS CAN BE ACHIEVED, let's make that clear.
TARGETS OR ENTRY PRICES ARE STRONG SUPPORT AND RESISTANCE LEVELS.
ENTRY PRICE BLACK COLOR
TARGETS GREEN COLOR
STOP LOSS RED COLOR
DO NOT USE THIS STROTEGY FOR LEVERAGED TRADING.
It will not give you the whole wave like any other strategy out there but it will give you a huge part of the wave.
The BEST TIMEFRAMES for this strategy are Daily, Weekly and Monthly however it can work on any timeframe.
Consider those points and you will have a huge advantage in the market.
There is a lot more about this strategy.
It can predict possible target and also give you almost exact buy or sell time on the spot.
I am developing it even more so stay tuned and start to follow me for more signals and forecasts.
START BELIEVING AND GOOD LUCK
HADIMOZAYAN
