MELI/N trade ideas

MELI Long Opportunity after the correction Mercadolibre is still correcting although drawing closer to a zone I expect a bounce/reaction.
Since Sept 2020 MELI has been trading inside a ascending channel and printed a fresh ATH in Jan 21.
I anticipate a move down to the bottom of the channel with the following confluences 200EMA,
.618 fib pull from bottom of the channel to the last swing high and the point of control *POC as drawn on the chart.
ALways know your invalidation and use a SL ..Like Share and follow for regular setups and analysis

Meli showing H&S Recently rallied off a great earnings but fell short of a new ATH and like most of the tech stocks that are reaching 52 week highs Meli looks to be distributing now.
Conformation or entry - Yellow line
Target - Green line or gap close

MELI - Looks like a head and shoulders is formingMELI is my 2nd largest position and I believe in the company long term, but there could be some short term pain. H&S is forming and the RSI looks to be continuing downwards.

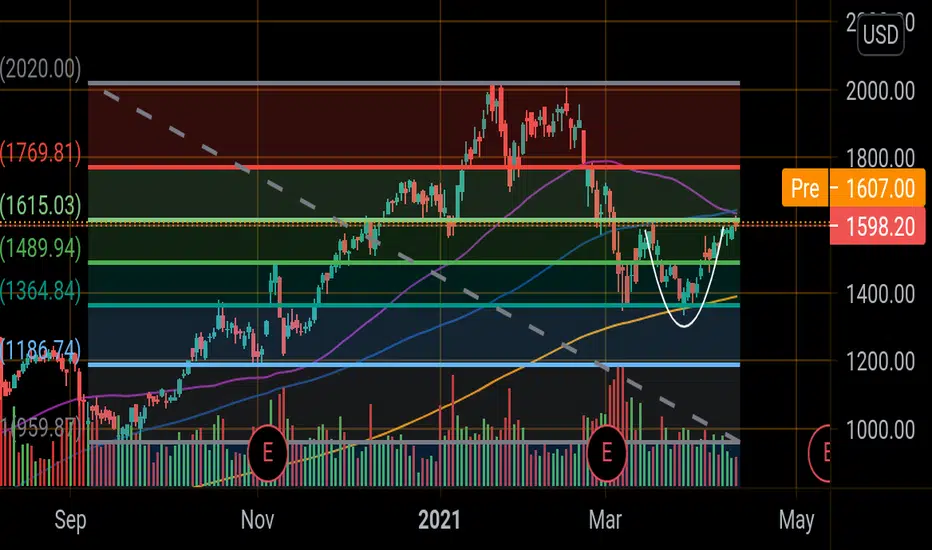
MercadoLibre $MELI making the reversalI see a lot of bullish signs in NASDAQ:MELI . The MACD is showing a bullish divergence making higher lows, the volatility has decrease with lower and lower volumen and the price is making a "cup & handle" patter; a classic reversal pattern. The only thing that doesn't meet my criteria is that the MAs aren't align the way I like. But, other han that everything looks very good.
With a buy above its resistance in $1,600 you could have a price target near $2,000 for a +24% profit with a 8% risk. That's a fair deal to me.

MELI Analysis showing possible drop.1d Time-Frame Analysis
Lets start with the bigger time-frame, with the bigger picture. NASDAQ:MELI is at level 2 rise, meaning it's missing one more leg to the upside. Then, why short this? Just checked the cycles and I see that MELI does level 1 rise, retrace, level 2 rise, M formation, drop. So instead of level 3 being the peak formation before the reversal, level 2 is the peak of the cycle, and now we are in level 2 with an M formation!
4h Time-Frame Analysis
4h time-frame seems to be a copy paste of 1d time-frame. We can see the cycle to the downside, with only 2 levels and the second level being the peak formation, and now we can see two levels to the upside, with this level 2 being the possible peak formation.
Trade light
Be careful guys, trade light. I'll set my SL at 1918.59, because if price touches that price level, the M formation will be possibly invalidated. Though, I'll wait for the close of the candle to be sure I'm not closing a stop-hunt rise. On the other hand from 1874.80 to our SL we have 2.34%, so playing big would mean a big loss. I will use a 2.5% of my entire account.
Take Profits
Close 30% at 1742.83
Close 35% at 1674
Close 35% at 1583
Happy trading!

$MELI 5 Month head and shoulders Base$MELI pullback setup after a 5 month head and shoulders base breakout early this month.


MELI longMeli formed a cup and handle formation which is a very bullish formation. Setting up for $1641 and possibly $1700 next week. Calls are pretty expensive but could pay out big.


MELI - Great resistance in MELI.Great resistance in MELI.
For my part I see it more bearish during the week.
Drop of 10-15% to generate some convincing pattern to think a continuation in the trend.


The breakout has not happened yet on MELI. This is our plan.Let's take a look at MELI. We can see two relevant aspects on the chart.
a) The price has broken an ascending trendline that has been working since MAY 2020
b) The price has been correcting for the last 4 months almost, and the main structure we can observe is a descending Wedge.
Based on those two items on the daily chart, this is our trading plan.
-We can see a clear resistance zone at 1600 - 1650 that has been tested 3 times. Therefore we don't want to take any setup below that level. So, we will wait for the price to reach it first. IF that happens and we see a move above that level, we want to observe a clear corrective pattern. Here we have defined an ABC structure (what we are looking for is something with similar proportions as the previous corrective structure that happened at the same level we are waiting for this one.
-If all the scenarios are aligned, we plan to take a setup, as you can see on the chart. The two levels above the resistance are the broken ascending trendline (working as a dynamic resistance) and the previous ATH. We think that a setup like this one can provide us with a 1.7 risk-reward ratio and a resolution between 10 to 20 days.
Quick Questions
And what if this never happens? - We don't trade, darling
Ok, smart guy, and what if you wait for all this and suddenly you have a stop loss? - We just take it with 1% of our account with a smile on our faces. Stop losses are a fixed cost of trading; start dealing with that instead of avoiding it.
Why don't you buy it right now? - Because Momentum trading / Swing trading is about waiting for confirmations and creating scenarios with a good risk-reward ratio (which means defining stop levels) so after 40 setups, you can have an edge (or a statistical advantage)
Thanks for reading, guys! all your questions and ideas are more than welcome in the comment box! Have a great week.


Meli possible Breakout Cup and handleGot rejected on 50day ma yesterday which made for a better handle. let's see if it breaks through today .
entry 1650
Purple line-50ma- 1637
Blue line-100 ma-1646
Gold line 200ma
white loop -Cup
Smart to add for long hold here?Hi Traders and investors.
This is my outline on rough guesses based on nothing but the chart, I don't know anything about this company, hence the loose targets on timing.
We have a key support on this one at 1338, which in my opinion is key for the speed of gains for current holders of the stock.
this is my take, always do your own dd. and take this as inspiration.
Regards.

MELI - ELLIOTT 5/3/5Hourly analysis. We sould be completing the 5th impulse within the hour fractal with a $1780 objective ( Ia m very new to this)
