3M dark day ahead Short on Support Break, Target 160A complete head and shoulder formation has been completed, and rebound on support, but which has been broken once, the next time testing that support will be a land slide down to 160.
MMM trade ideas


3M - Macro outlook and planI am starting to develop a framework for how I manage my portfolio.
Here is a glimpse into the TA/FA view, and summaries I am preparing for each chart, to always know where I'm at, relative to a company I'm invested in, or any asset I might be speculating.
Charts will be directly associated with a spreadsheet, where I'll organize my asset mix, sizing, and positioning.


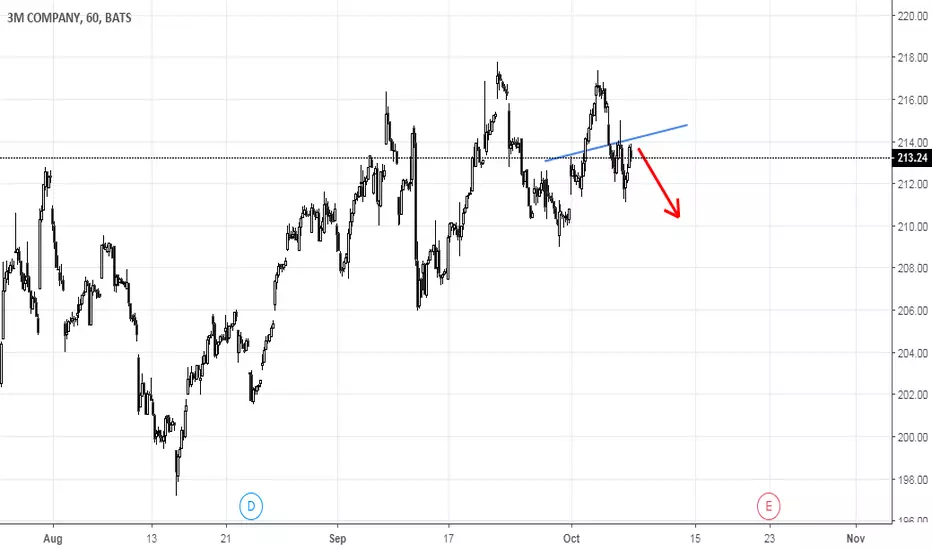
$MMM - Retest of the UTL, Now DOWNLast week was a retest of the uptrend line resistance. Planning to enter puts on Monday with a stop loss above the h/s neckline.
My stop loss/ price target is on the chart.


MMM Earnings playAfter bearish lead into Earnings and positive Earnings reports in the sector. With an $8.19 market maker move. A long call option here would be a good play.


MMM71 Fundamental score.
Could pose wonderful shorting oportunies if the S&P continue down at market open

$MMM Rising Wedge Pincher PLAY w/ 200 MA LOOMING!$MMM is your stock if you like rising pincher plays.... trend lines on price action shown in black on this chart... treding upwards and making higher highs and higher lows, but the 200 MA is looming of SO many stock within the DOW30 right now on these DAILY charts... if it is respected by the price action... the likely outcome will be prolonged stagnation moving forward with expectations of a solid 2019 fiscal year ahead within the US economy.... IF THE 200 MA gets busted with som UMPF... well the price will then climb in my opinion... watch how the price busts out of the rising wedge demonstrated by the trend lines in black... if price goes through upward trend line; expect BULLS TO RUN... if bottom wedge/trend line is busted... TIMBERRRRRRRR! lol

3mJK I expect this to start ripping up to close out the year break the 217 level and close over will see steady movement up. That stop run signaled up side. Your good!

MMM - Discount Buy or No?Find the commentary from the chart below:
In general, the stock paints a bullish picture but there are also things that could indicate that it would rather trend downwards at least for some time.
Bullish points
-Stock is currently above the 120 moving average which has served as a support level since 2011 on weekly chart
-Stock is currently In an uptrend and hence current downward move may be a correction and oportunity to buy in the larger trend
-The 188 support level is intact, and has held since it was formed & the short term resistance level at 212 just got broken last week and so there is some bullish interest in the stock
-Dividends have experienced increase by 15% this year (from 1.11 -> 1.18 last year -> 1.36 now this year for each quarter)
-Quarterly actual earnings and earnings estimates have all been growing along with stock price and hence it can be inferred that the company is expanding and may continue to be profitable for at least the next few years (longterm outlook idea)
Bearish points
-The price behavior with 120 moving average this time around has been sharper, larger and more aggressive this time around without truly breaking and testing 120 moving average; this could mean the moving average break is rather yet to come and so more patience should be had (if so an entry with a smaller position can be made, and then more size added as trade begins to work)
-Stock has a long way to break out of 255 in order to confirm uptrend, but waiting for price to reach there from its current price at ~212 would mean you would miss the uptrend move in this case; this could be a good idea to exercise patience, but the aggressive correction I already mentioned could mean the very early stage of a shortterm downtrend at least with 255 being the peak price (simply put, because of the price behavior, you would be safer buying from support and deciding to add or close trade after stock reaches 255 rather than waiting for move to 255 and then buying into breakout).
-The 188 support level has been intact since it was formed, but it can break with pressure of earnings & a true test of 120 moving average; if these price tests occur and are strong enough, it could set the stock up for a downtrend.
-Dividends and earnings growth may indicate future longer term growth and NOT shorter term price action; even though the "numbers" of the company may look nice, it may be moving upward now as a sympathy play since sector (XLI') is also doing well right now.
(This stock will not be traded as part of paper portfolio challenge)
Let's follow MMM' to see how it plays out!
Thanks!

MMM Buy OpportunityMMM is currently down 18%-20% from all time highs and is offering buyers a good discount to buy the stock here below the 50day moving average and above the 200 day moving average. The moving averages are beginning to curve higher/ signaling that the stock should continue to go higher. As the overall U.S stock market has made new highs, this is a good option for an investor to buy "a dip" in a strong company and in strong economy. Feel free to comment.
Looking to buy stocks with no commissions? Open a robinhood account today and get 1 free share: share.robinhood.com


$MMM - lots of post-its between here and 240Under pressure with the dow, seems ready to reverse with a nice IHS as a bonus

3M Multiple Bottom, this is only going upMMM has had a poor year for most of 2018. But its decline has found support at $194.65 and has multiple times. High volume on the upswing of the dips further confirms that this stock is likely to go up. Sell if it breaks $194.65.


Long Term Bear Market ? If a five wave impulse is done, we should expect 'at least' a three wave correction (at the same degree) to unfold.
The beginning of wave (1) starts from March 2009 at $32.28 and if this year's top ($258.51 in January) is the end of wave (5), a multi year correction (or bear market for 3M) will be inevitable.
Note:
The length wave (5) equals approx. total distance from the start of wave (1) to the end of wave (3)
RSI made new lower highs when price moved into new higher highs

3M Short in the boxWaiting for a hit of the upside green box (labeled 4), for a short targetting 5 down. This will put me on watch for a long term bottom
With respect to what I said in MMM Micro -- the linked idea - the clue was the fact that the first wave up didn't hit my desired green target, and now we have staged a very corrective looking move up. This has put me on high alert in terms of a good potential to seeing lower lows
