Overbought levels, could hit 295 before correctionWith top oscillators beyond the OB level, the trend looks to be going in daily, and a hangman is bullish, but it sits on the cusp of a DT. Fireworks!
MNDY/N trade ideas

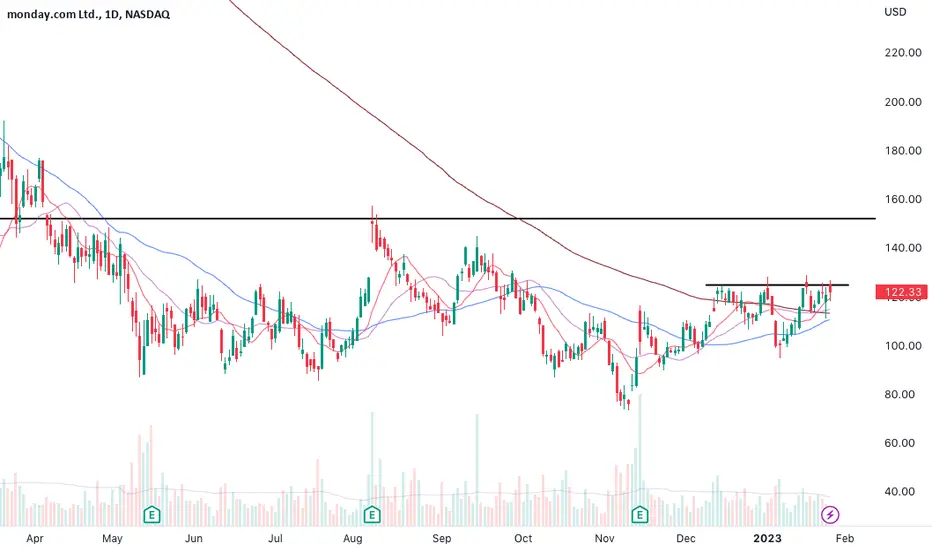
Monday.com May Start MovingMonday.com has drifted for the last year, but some traders may think the business-software company is ready to start moving.
The first pattern on today’s chart is the bullish price gap on February 10 after earnings, revenue and guidance beat estimates. The shares touched their highest level since late 2021, only to decline with the broader market.
However, the slide wasn’t significant and MNDY stabilized at lows from January. The shallowness of the pullback may reflect a lack of selling pressure.
Second, the 50-, 100- and 200-day simple moving averages are virtually on top of each other. Does that long-term neutrality create potential for price expansion?
Next, MNDY has pushed above a falling trendline.
Finally, MACD is rising.
TradeStation has, for decades, advanced the trading industry, providing access to stocks, options and futures. If you're born to trade, we could be for you. See our Overview for more.
Past performance, whether actual or indicated by historical tests of strategies, is no guarantee of future performance or success. There is a possibility that you may sustain a loss equal to or greater than your entire investment regardless of which asset class you trade (equities, options or futures); therefore, you should not invest or risk money that you cannot afford to lose. Online trading is not suitable for all investors. View the document titled Characteristics and Risks of Standardized Options at www.TradeStation.com . Before trading any asset class, customers must read the relevant risk disclosure statements on www.TradeStation.com . System access and trade placement and execution may be delayed or fail due to market volatility and volume, quote delays, system and software errors, Internet traffic, outages and other factors.
Securities and futures trading is offered to self-directed customers by TradeStation Securities, Inc., a broker-dealer registered with the Securities and Exchange Commission and a futures commission merchant licensed with the Commodity Futures Trading Commission). TradeStation Securities is a member of the Financial Industry Regulatory Authority, the National Futures Association, and a number of exchanges.
TradeStation Securities, Inc. and TradeStation Technologies, Inc. are each wholly owned subsidiaries of TradeStation Group, Inc., both operating, and providing products and services, under the TradeStation brand and trademark. When applying for, or purchasing, accounts, subscriptions, products and services, it is important that you know which company you will be dealing with. Visit www.TradeStation.com for further important information explaining what this means.

Monday BluesTech is overvalued across the board, especially names like Monday trading at PE ratio of 535 and Forward PE of 67. Revenue growth has been high but signs of deceleration ahead. If the stock market drops heading into the New Year 2025, I think this will be one of the first to fall.
Technically we are in a bearish rising wedge pattern and we appear to be on the verge of a large drop. Somehow we closed the week within this pattern and have held the important 0.382 Fibonacci.
Will support hold? It’ll be an interesting week or two ahead for this stock. I plan to short of the market structure confirms a downtrend.
Not financial advice, do what’s best for you.

$MNDY - MONDAYNASDAQ:MNDY - Breakout
After an initial increase of 45%, the price action consolidated with higher lows and reduced volatility (VCP).
Entry 284
Stop loss 273
TP1 30-50%: after 4-5 days
Then Stop follow up (visual) with EMA 10 or EMA 20
Let's see on Monday the price action :)

My Watchlist: MNDYMNDY, an IBD50 stock has a setup signal (1). I'm looking to enter long near the close of the day if the stock can manage to CLOSE above the last candle highs(2). If triggered, I will then place a stop-loss below (3) and a price target above it (4).

MNDY Bull FlagNASDAQ:MNDY has consolidated for 4 days post-earnings. Three bearish candles were observed, followed by a bullish candle closing above the previous two days. This is a bullish signal. The key level of $261 has been surpassed - this is the level of the Volume Point of Control (VPOC) across the three bearish days where sellers were present. Price is also holding a significant level at $255.50, which was the resistance dating back to the COVID bubble collapse. Price tested this level on Friday, and buyers instantly stepped up. This is demonstrated by the first 65-minute candle that had increased Average True Range (ATR), clearly showing buyer interest.
The setup for this name is straightforward: an Anchored VWAP (AVWAP) trade. Price has tested the AVWAP to earnings release, as well as the key level. Price offers a slim spread. The entry point is a break of the High of Day (HOD) at $263.79, with a stop loss at the Low of Day (LOD) at $253.51, below the AVWAP.
Trade targets are based on fair gaps and liquidity levels:
First target: $300 (round number), a 3.5R target
Second target: $313, a 4.85R target
Remember to monitor stop loss orders and manage risk accordingly.

End of correction? 1. Impuls: yes 12345+abc = short 1D
2. Trigger: no
3. Candle: no
4. Channel: bounced on the top
5. Resistance/Support: yes support its bounced
6. Trend: short
7. Brake out: no
8. Febo´s: correction near 50.0%
9. EW Impulse: yes 4H + 15M short
10. EMA 200 / SMA 50: since 2023-03-10 in correction
11. Pattern: yes - ABCD extension + bat short

Monday.com Stock Surges 19% On Q1 Earnings & Revenue BeatMonday.com ( NASDAQ:MNDY ) reported first-quarter earnings and revenue that topped estimates, with the software maker's revenue guidance for the stock edged by views. The company reported a profit of 61 cents a share on an adjusted basis for the quarter ending March 31, up 335% from the previous year. Revenue rose 34% to $26.9 million, beating analysts' predictions of 40 cents on revenue of $210.5 million. For the current quarter ending in June, Monday.com predicted revenue of $228 million vs. estimates of $225.2 million.
Monday.com shares ( NASDAQ:MNDY ) soared 19% to $217.35 in premarket trading, with the stock having retreated 3% in 2024. The workspace software provider competes with Asana (ASAN), Smartsheet (SMAR), and Atlassian (TEAM), among others. Monday.com ( NASDAQ:MNDY ) raised $574 million in its June 2021 initial public offering, with MNDY stock priced at 155.
Monday.com ( NASDAQ:MNDY ) added customers, set a free cash flow record, and gave better-than-expected guidance. The company posted first-quarter adjusted earnings per share (EPS) of $0.61, more than 50% above estimates compiled by Visible Alpha. Revenue increased 33.7% year-over-year to $216.9 million, also beating forecasts. Free cash flow was $89.9 million. As of the end of March, the number of customers with more than $100,000 in annual recurring revenue (ARR) skyrocketed 55% to 911, and those with more than $50,000 in ARR jumped 48% to 2,491.
Technical Outlook
Monday.com ( NASDAQ:MNDY ) share is up 19.59% as of the time of writing, trading with a Relative Strength Index (RSI) of 65.96 which is within the overbought region. On the daily price chart, Monday.com ( NASDAQ:MNDY ) share depicts an upside gap or Upward gapping which is a bullish reversal pattern as a result of the earnings beat.

$NASDAQ:MNDY 2024-03-30 looks bullishNASDAQ:MNDY
- Great revenue and revenue growth
- Great cashflow
- consolidate for a few weeks
- low risk position can be entered here with stoploss < 5%

MNDY 2 Year Breakout AttemptMNDY looks ready to blow the doors off on a volume spike and successful flip of that $193 level. Bounced off the 50 EMA and looks hungry for more.

$MNDY ready to go The stock is tightening up and getting ready for a breakout.
I will watch it and interested in buying.
The key resistance zone is 200.

MDY Swapping its Resistance to SupportA correction is favorable here for the market with a correct to its last resistance zone that could now become its support around 182$
Long term view -> MNDY is up

Bullish MondayMonday.com Beats Expectations in Earnings Report, Stock Rises by 4.6%
As a result of Monday's earnings report, monday.com (MNDY) beat analysts' expectations. The company reported earnings per share of 0.64 on revenue of 189.19 million, surpassing analysts' expectations of 0.18 on revenue of 182.51 million. This positive news caused the stock to rise by 4.6% to $171.22.
In comparison to its daily average volume of 1 million shares, monday.com's daily average volume yesterday was 140% higher. This increased trading activity indicates a heightened interest in the stock.
Monday.com's quarterly earnings report showcased a significant increase in both revenue and earnings per share compared to the previous quarter. The company's revenue increased by $189.19 million, and its earnings per share rose by 0.64.
Over the past 5 days, monday.com has experienced a 26.43% appreciation in its stock price. Currently, the company is trading with a market cap of $8.27 billion.
In addition to monday.com, other technology sector stocks also saw positive movements. Intel (INTC) rose by 3.04% to 40.61, Sony Group Corporation (SONY) closed at 87.12 after a 2.41% increase, and Accenture plc Class A (Ireland) (ACN) was up 1.56%.
Overall, monday.com's strong earnings report and stock performance indicate positive momentum for the company in the market.
Technical Outlook
Monday.com Approaching Key Resistance Level
Asset Symbol: MNDY Latest Price: $171.22 Asset Class: Stock
Monday.com Ltd. is approaching a key resistance level at 145.46, now only 9.61 away. Breaking above this level could open up a new path for further gains.
Monday.com bulls are aiming to push the stock past the key resistance level at $176.03 as the next upside milestone if they maintain their dominance.
The price action is currently receding away from an active Fibonacci resistance level at $143.97.
In the past 5 days, Monday.com's share price has risen by 26.32%. Today, it is expected to rise by a further 7.53, or 4.6%. Yesterday, the stock reached a high of 173.85.
Other key facts about Monday.com:
Market cap: $8.27 billion
Total shares traded yesterday: 1.41 million (higher than the multiday average of 1 million)
Technical analysis reveals that Monday.com's CCI indicator is above +100, indicating that the market price is unusually high and above its rolling moving average. The stock is currently rated as "Neutral" during a positive session in which it is gaining $7.53, or 4.6%.
Overall, Monday.com is showing strong bullish momentum and has the potential to break through the key resistance level at $176.03, leading to further gains in the near future.

Monday.com (NASDAQ: MNDY) Surged In Early Monday TradingMonday.com Earnings
a. The third quarter revenue was $189.2 million, a 38% year-over-year growth.
b. A 57% increase year-over-year in customers contributing more than $50k in annual recurring revenue (ARR).
c. A record quarterly non-GAAP operating margin and free cash flow.
d. The firm beat estimates with $189.2 million in revenue vs. the expected $182.5 million and an EPS of $0.64 vs. the expected $0.21.
Expanding High-Value Customer Base: 57% Growth in $50K+ ARR Segment
A notable aspect of monday.com’s third-quarter success is the substantial growth in its high-value customer segment. The number of customers contributing more than $50,000 in annual recurring revenue (ARR) surged by 57% year over year. This surge shows the company’s effectiveness in attracting and retaining large-scale clients. The co-CEOs emphasized the importance of monday DB, their new infrastructure underpinning the WorkOS platform, in attracting and maintaining these high-value relationships. The rollout of monday DB, which is ahead of schedule, is already receiving positive feedback for its significant speed improvements and enhanced capabilities.
Technical Analysist
Price Momentum
MNDY is trading in the middle of its 52-week range and near its 200-day simple moving average.
What does this mean?
Investors are still evaluating the share price, and the stock is still trying to generate some momentum. This is a positive sign for the stock's future value.


$MNDY Failed Breakout Reset SetupNASDAQ:MNDY also failed breakout reset setup.
Attempted to breakout on the 17th and failed back to its rising 50 MA.
OBV holding close to is recent highs and U/D holding above 2. Not much selling going on while this tries to build up energy for its next thrust higher.

$MNDY Setting up below a major pivot. MNDY looks healthy and is possibly setting up.
The setup: 52-week high breakout above $187 pivot
Late Jan, it came above the 200dsma and rode the 21-day ema for about a 25%-30% move then started to drifted back in undercutting the 200dsma for four days in early May. This four day undercut traded on above average daily volume without further progress to the downside, this can be interpreted as supporting action. A week later the stock gapped up on 5/15 due to earnings announcement and put in an HV1 (highest volume traded in 1 year).
It hasn't closed the gap and found support at the 50dsma. Relative strength is also lifting nicely.
$187 is a significant pivot when viewed on a higher time frame (look at the weekly).
Breakout traders might consider this actionable above $187, especially if it's followed by volume.
Risks:
There is clear overhead supply from 2021. (obstacle to become a ML)
The company has negative earnings
Revenue growth is decelerating
A breakout might result in a nice 10%+ opportunity with decent risk management below the recent multiday tight consolidation around $174 (~7%).
A pullback and hold of the breakout would be confirmation of a stage 2 uptrend.

$MNDY Pullback SetupNASDAQ:MNDY looks very constructive here for a low risk pullback setup.
* volume pattern looks good
*OBV pegged to highs
*U/D ratio 1.9
* Consolidating around 21 EMA

MNDY Uptrend rectangle pattern Near pivot PointNASDAQ:MNDY Uptrend rectangle pattern weekly chart, above AVWAP from Highest point and ipo day.
Near from pivot point(178). if there is Breakout above 178our Target will be around 366.

MONDAY approaching the top of the Channel Up.Monday.com Ltd (MNDY) is testing today the 1W MA100 (red trend-line) for the first time, being just below Resistance 1 (192.50) and the top (Higher Highs trend-line) of the 8-month Channel Up. This is a strong medium-term Resistance cluster and as the 1D RSI is about to hit its Higher Highs trend-line of its own, we will be looking to sell and target 135.00, on a potential contact with the 1D MA200 (orange trend-line), near the bottom of the Channel Up.
-------------------------------------------------------------------------------
** Please LIKE 👍, FOLLOW ✅, SHARE 🙌 and COMMENT ✍ if you enjoy this idea! Also share your ideas and charts in the comments section below! **
-------------------------------------------------------------------------------
💸💸💸💸💸💸
👇 👇 👇 👇 👇 👇

$MNDY Bull Pennant?Look for a break-out or breakdown out of this formation. I lean bullish "if" the market cooperates. I have alerts set for either direction. Ideas, Not investing / trading advice.

MNDY day trade opportunityMNDY supply was tested and is now trying to break the zone.
a good 2R trade available in short term, planning to enter a trade if it hits my entry and book 80% at the mentioned take profit level and going to it run for 153+ for the rest 20%

Stock Idea: $MNDY (27 Jan 2023)$MNDY
- Low cheat within larger multi-month base
- Young stock, IPO-ed 2021