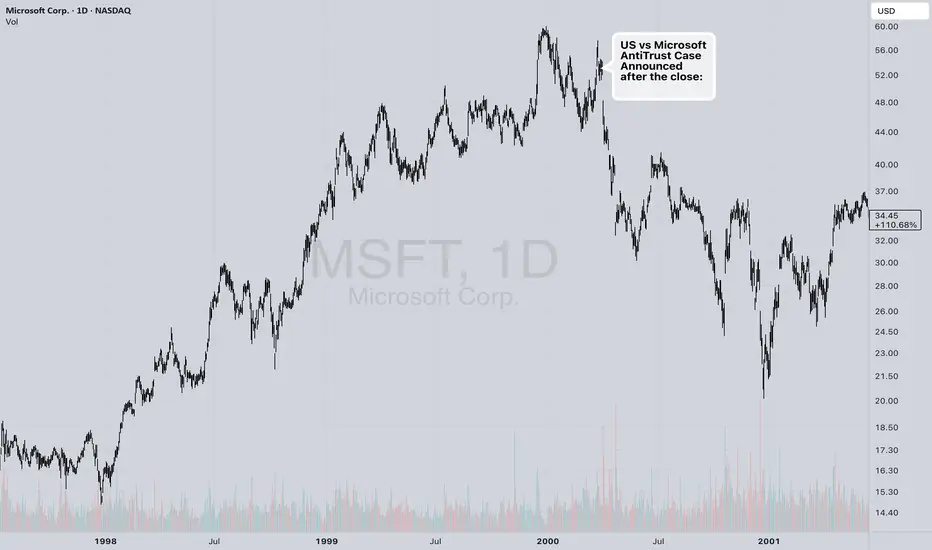
Does Everyone Remember Why The Bubble Popped in Y2K?I heard on Bloomberg Television this morning that they didn't have any recollection of a good reason for the stock market bubble of 1995-2000 to pop. I was stunned that a portfolio manager of such standing had the guts to say that he didn't understand why the market topped in 2000.
This is how history gets re-written by people who didn't pay attention and didn't learn from the past, so how can we trust anything that we read, see, hear today? People don't remember. Why don't people remember? I think that is the fodder for someone to write a book, which isn't the point of this publication today.
What I think "market history" means to us is that there is a fair and unbiased reporting of history and what TradingView does by keeping people's published charts online and not deleting bad forecasts is very refreshing. When TradingView started, I knew immediately that this model was the way to go. It was easy for people to "delete a Tweet" about their "buy recommendation" that didn't pan out. It was easy for people to "lie by omission" by removing the bad forecasts and keeping the ones that worked.
I can add a couple of other points about the Y2K top: One of them was the SEC chairman Arthur Levitt starting the idea of a rule in December 1999 for "Fair Disclosure". This eliminated anyone getting any special information ahead of the crowd and assured a 'level playing field.'
There was another Government Regulation to limit the speed of dial up internet access to 53K from the stated 56K speed. This was in 2000.
The chart published is the close of March 31, 2000 when the Gov't announced their ANTI-TRUST CASE AGAINST MICROSOFT with the stock at $53.13. On Monday, NASDAQ:MSFT opened at $47.22 closed at $45.44, -7.69 that day and proceeded to drop to $20.13 over the ensuing bear market. $53.13 to $20.13 is a massive $33 point drop.
MSFT trade ideas
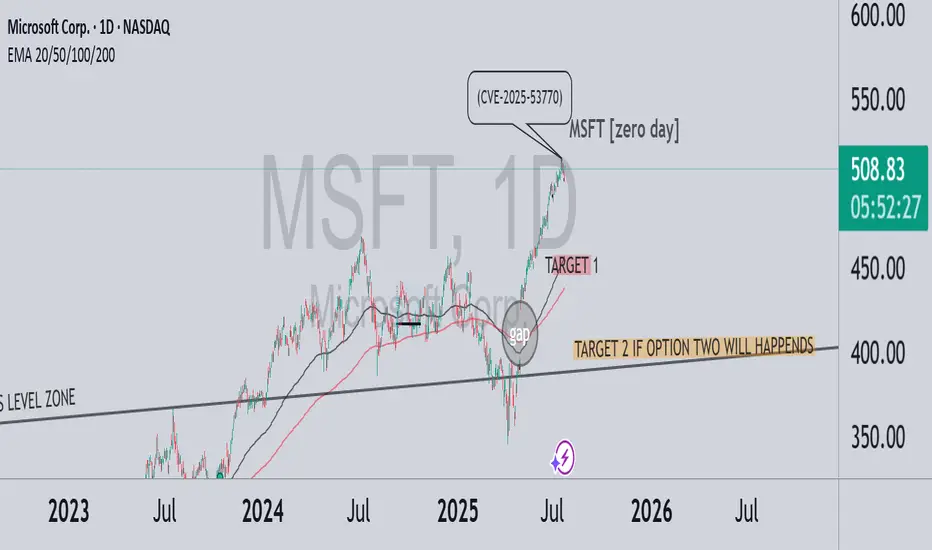
MSFT – A correction brewing? zero day CRWD-like scenario?In July 2025, a critical vulnerability in Microsoft SharePoint (CVE-2025-53770) was exploited by threat actors globally. Although the issue was first reported during the Pwn2Own Berlin competition back in May, Microsoft delayed the patch — allowing attackers a significant head start. Over 400 servers and dozens of organizations were breached, including U.S. and European government entities.
💬 On July 18, Reddit users began discussing the flaw’s severity, comparing it to past vulnerabilities like Log4j. Interestingly, this coincided with the first significant technical deviation from the bullish trend — marking a potential beginning of downside momentum.
🔍 In the chart above:
Strong bullish run until the Zero-Day disclosure
Clear gap beneath current price action
TARGET 1 reflects a natural technical retracement toward EMA 50–100 and the mid-term trendline
TARGET 2 is conditional – it only applies if a massive event occurs, similar to what we saw with CRWD
⚠️ Key distinction:
CrowdStrike: A software update bug caused a global Windows crash — no cyberattack, but massive operational impact
Microsoft: A real, actively exploited security vulnerability — with long-tail risk for data leaks, ransomware, and regulatory backlash
🎯 Conclusion:
If the SharePoint exploit escalates in visibility or consequences, and Microsoft fails to contain the damage — we could see extended downside pressure. TARGET 2 remains valid only under a high-severity scenario, like CRWD’s global meltdown.
Don't Short MSFT. 2 long scenarios. Hi, I’m The Cafe Trader.
Today we’re diving into the heart of this very bullish run on MSFT. One of the key lessons I’ve learned:
Never get in the way of a strong bull trend — especially just after a breakout.
⸻
🔍 Price Action Overview:
MSFT has been respecting a strong trendline since its initial gap-up.
This has created multiple breakout trade opportunities — and we’ve just spotted another one. I’ve also outlined a secondary setup worth watching.
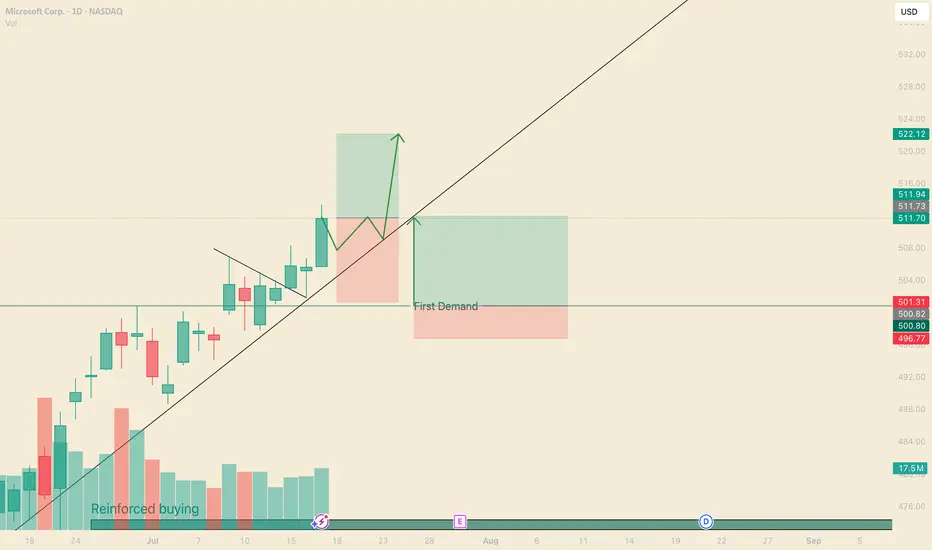
We recently completed a 3-bar break.
Combine that with rising volume, and this suggests a potential move to $522.23.
⏳ I’m expecting a brief consolidation (2–3 trading days) before the next leg up.
⸻
🟢 Trade Setup:
• Entry: $511.70
• Risk Level: Trade remains valid until a daily close below $500
• Reward: TP at $522.23
• Risk-to-Reward: 1:1 at entry; improves with any dip before breakout
⸻
💡 Optional Trade: Swing Trading Options
Options are about two things: price and timing.
Right now, timing looks great — but option pricing is a bit high.
The key is to go from out-of-the-money to in-the-money, and to give yourself at least 5 days on your contracts.
Here are some strike prices I’m watching (assumes expiration 7/25 or later):
• $515 Call — Entry: $2.00 or less → TP: $6.00+
• $517.5 Call — Entry: $1.30 or less → TP: $3.90+
• $520 Call — Entry: $0.70 or less → TP: $2.10+
These levels give you a strong RR if you can catch the right pullback.
⸻
🔁 Secondary Trade Idea: Bounce at $500
The $500 level is both a psychological number and a reinforced demand zone.
While it overlaps with the stop on our main setup, this trade assumes MSFT pushes higher first, then retraces to $500 for a fresh leg up.
This area will likely play a key role in future price action.
If we see a pullback into this zone with contextual selling pressure, it could offer a clean high-probability bounce.
Take profit levels would depend on how price behaves as it sells into this level — but keep this area marked.
⸻
Thanks for reading — be sure to check out my other MAG 7 analysis.
@thecafetrader
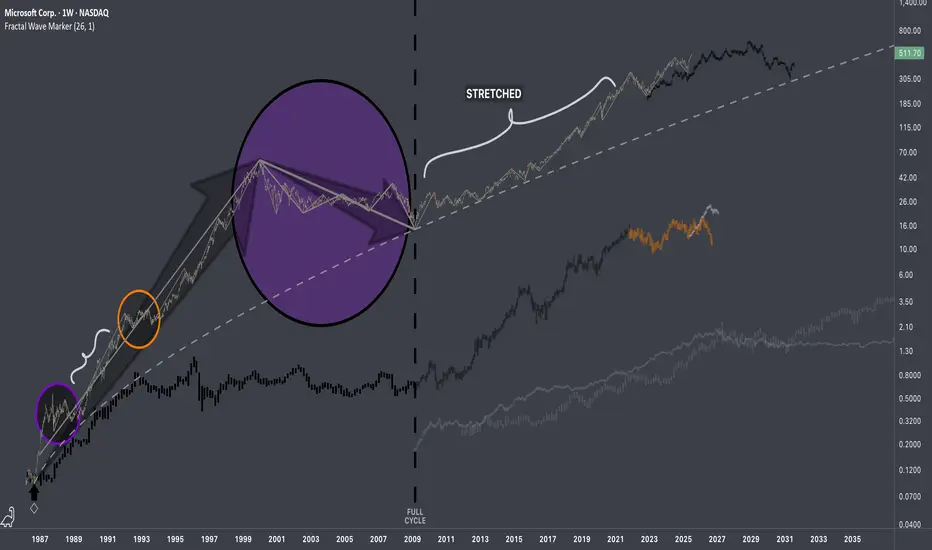
$MSFT: Fractal Hierarchy IResearch Notes
Fluctuations reappearing at broader scale.
If both are manifestations of the same pattern, then the next segments can be applied accordingly.
The remaining part can be deformed (depending on future volatility which can accelerate completion of composite sub-cycles)
Documenting it publicly to keep record of these particular recurring patterns.
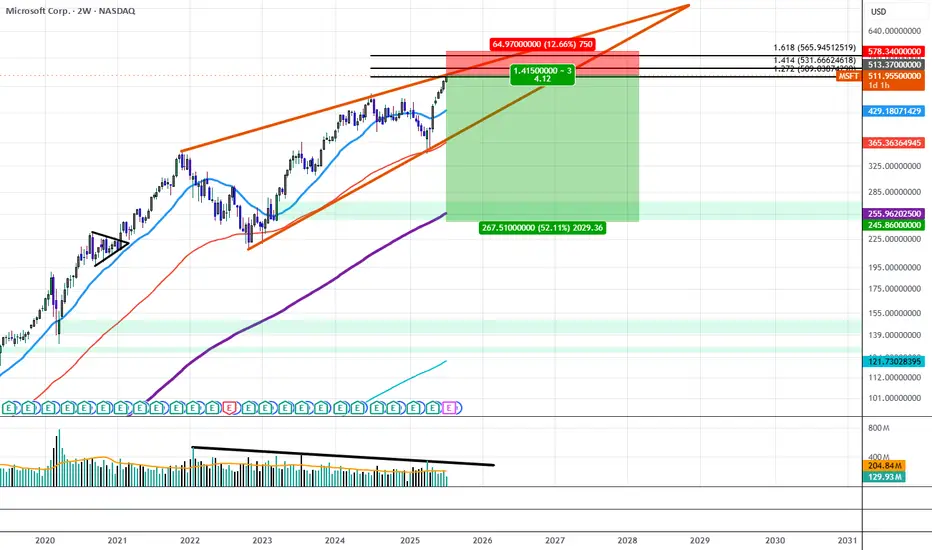
Microsoft Sees Declining Trading Volume Despite All Time HighsSince December of 2021, MSFT traded within a Rising Wedge structure that has gradually resulted in lower and lower highs in volume, at the same time IV on the Options Chain has begun to price down the strikes above $515 while Shorter Term Downside IV has begun to price up all the way out to $240.00. If this trend continues we will likely see the $515 area act as strong resistance as liquid interest above it begins to dry out.
This could be the beginning of a move to break down the wedge and trade down to the lower strikes first targeting the $365 price level and resolving around $240 near the 200 Period SMA.
MSFT - Should you Buy All Time Highs?Hello everyone, I’m TheCafeTrader.
Next up in our breakdown of the MAG 7 is Microsoft (MSFT) — this post focuses on a long-term swing trade setup.
For short-term analysis, head to my profile and check out the latest posts.
⸻
💡 The Setup:
MSFT continues to ride a strong wave thanks to AI growth, especially with Copilot and its projected impact on revenue.
Several analysts have price targets ranging from $550 to $600, which still leaves 10–20% upside from current levels.
As of this writing, MSFT closed at $511.70, about 9% above its previous all-time high — and it got there in just five weeks.
Momentum is strong, and there’s no clear sign of slowing down.
⸻
📈 Is Now a Good Time to Buy?
Let’s look at two possible strategies:
⸻
Dollar-Cost Averaging (DCA) vs. Lump-Sum Investing
If you’re unfamiliar with DCA: it’s a strategy where you buy in gradually over time.
Say you have $5,000 set aside for MSFT — you might invest $1,000 now and continue adding monthly.
This is a smart approach in choppy or uncertain markets, but MSFT is not showing weakness right now.
Historically, when strong stocks are in clear bull trends, lump-sum investing outperforms DCA.
So if you’re confident in MSFT’s long-term potential — and want exposure to the current momentum — a full position now could make sense.
If you’re looking for a better price or want to scale in patiently, keep an eye on these key zones.
⸻
🧭 Areas of Interest on the Chart:
1. Yellow Box (Target Zone):
→ $550–$600 is the broader analyst price target range.
2. First Demand Line (~$500):
Recent signs of active buyer interest. If bulls remain in control, this could act as a springboard.
3. Reinforced Buyer Zone (~$472–$474):
This area has been tested and defended before. It’s a strong pullback entry if momentum stalls.
4. Second Demand Line (~$449):
A previous base of institutional accumulation. Price may revisit here in a broader market dip.
5. Deep Buyer Zone (~$344–$365):
A rare but powerful level where big money entered aggressively. It’s unlikely we revisit this zone — but if we do, it could be a great buy.
⸻
🧠 Strategy Summary:
• Aggressive buyers may consider entering around $500, where recent demand appeared.
• More patient traders might wait for MSFT to pull back into the $449–$474 range, where institutional interest has been high.
• The $344–$365 zone is a long shot — but would be a massive value area if touched.
⸻
That’s it for the long-term outlook on MSFT.
For more short-term trades and entries, check out my other posts — especially as we continue tracking the MAG 7.
@thecafetrader

MSFT Setting Up for a Breakdown or Bounce - July 16MSFT Setting Up for a Breakdown or Bounce – Key Option Levels in Play 💥
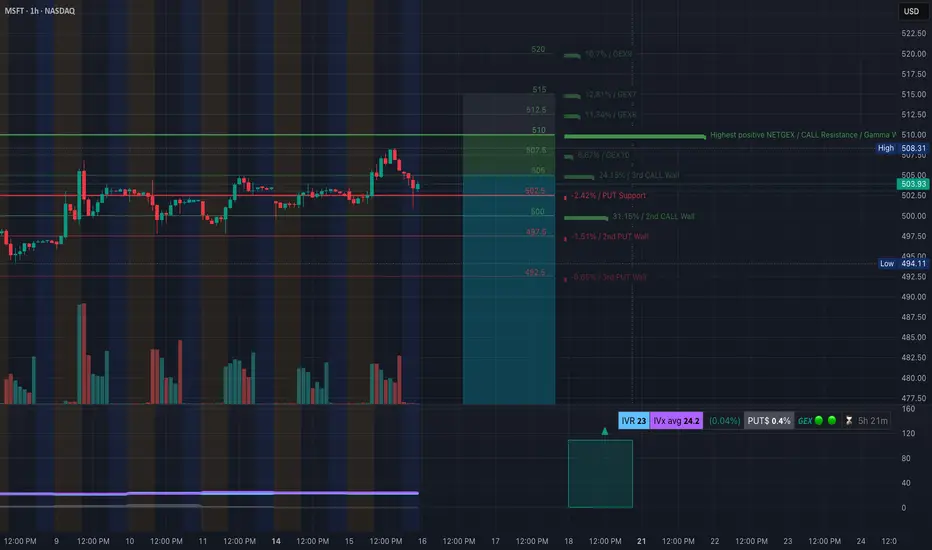
🔹 Options GEX Analysis (Tanuki GEX View):
* Gamma Resistance (Call Wall):
→ $510 is the highest GEX level, acting as a ceiling.
→ $507.5 is the 3rd Call Wall and minor resistance.
* PUT Walls and Gamma Support:
→ $502.5 = HVL (High Volume Level)
→ $500 = key strike with heavy Put interest
→ $497.5 and $492.5 = deeper support levels
* GEX Bias:
→ IVR = 23, IVx avg = 24.2
→ 0.4% Put Skew → Neutral bias with slight downside lean
→ If MSFT trades below $502.5, dealers may start to hedge short, increasing downside gamma pressure.
🟩 Option Trade Idea:
* Bearish Put Debit Spread:
Buy $505p / Sell $495p for next week
Entry near $503, looking for breakdown to $497.
* Neutral Fade:
Sell Call spread near $507.5–510 if price stays below $504 by open.
🔹 1-Hour Chart Trading Setup (Price Action):
* Structure:
MSFT printed a CHoCH after failing to break the $507 supply zone (order block).
Price lost trendline support and is testing $502 area again.
* Smart Money Concepts:
* BOS occurred into 506s before reversal
* CHoCH confirmed at $502
* Current price is consolidating just above $502. Break below signals weakness.
* Support Zones:
* 502.5 → 500 → 497.5
* Demand at 493–488
* Resistance Zones:
* 504.5 → 506.5 → 510
* Overhead OB rejection seen on last attempt
🟦 Intraday Trade Setup:
Bearish Breakdown Setup:
* Entry: Below $502
* Target: $497.5 → $493
* Stop-loss: $504.50
Reclaim & Squeeze Setup:
* Entry: If holds above $504.5
* Target: $507.5 → $510
* Stop-loss: $502
🧠 My Thoughts:
The failed breakout and CHoCH hint that MSFT may drift down unless it reclaims $504. With options GEX neutral-to-bearish and IV low, a fade toward 497.5–493 could be in play. However, if buyers step in at HVL $502.5 and flip the trendline, we may see a gamma squeeze attempt to $507–510.
This analysis is for educational purposes only and does not constitute financial advice. Always trade with a plan and proper risk management.
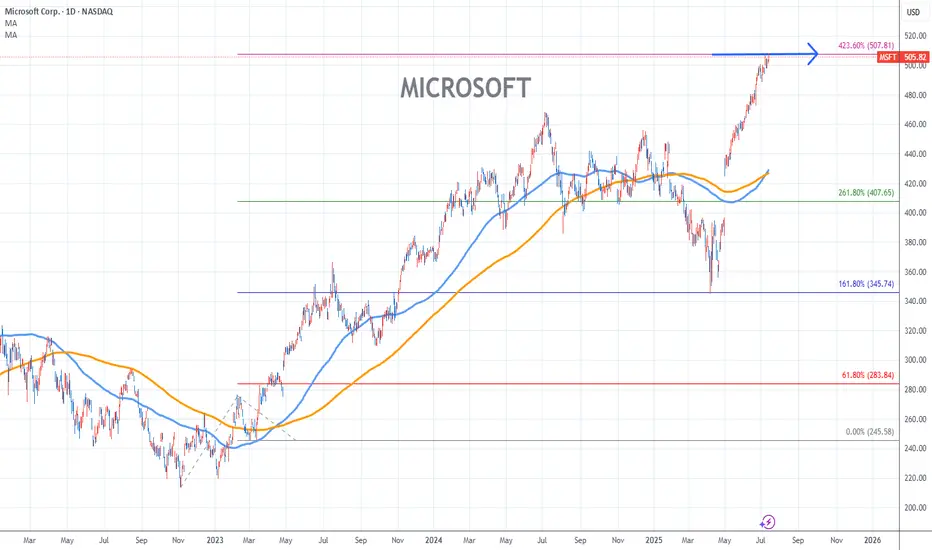
MICROSOFT Stock Chart Fibonacci Analysis 071525Trading idea - Hit the top > 507/423.60%
Chart time frame:D
A) 15 min(1W-3M)
B) 1 hr(3M-6M)
C) 4 hr(6M-1year)
D) 1 day(1-3years)
Stock progress:E
A) Keep rising over 61.80% resistance
B) 61.80% resistance
C) 61.80% support
D) Hit the bottom
E) Hit the top
Stocks rise as they rise from support and fall from resistance. Our goal is to find a low support point and enter. It can be referred to as buying at the pullback point. The pullback point can be found with a Fibonacci extension of 61.80%. This is a step to find entry level. 1) Find a triangle (Fibonacci Speed Fan Line) that connects the high (resistance) and low (support) points of the stock in progress, where it is continuously expressed as a Slingshot, 2) and create a Fibonacci extension level for the first rising wave from the start point of slingshot pattern.
When the current price goes over 61.80% level , that can be a good entry point, especially if the SMA 100 and 200 curves are gathered together at 61.80%, it is a very good entry point.
As a great help, tradingview provides these Fibonacci speed fan lines and extension levels with ease. So if you use the Fibonacci fan line, the extension level, and the SMA 100/200 curve well, you can find an entry point for the stock market. At least you have to enter at this low point to avoid trading failure, and if you are skilled at entering this low point, with fibonacci6180 technique, your reading skill to chart will be greatly improved.
If you want to do day trading, please set the time frame to 5 minutes or 15 minutes, and you will see many of the low point of rising stocks.
If want to prefer long term range trading, you can set the time frame to 1 hr or 1 day.
MSFT watch $392.76-394.12: Key Resistance to Tariff RecoveryMSFT testing a well proven Resistance zone $392.76-394.12
This zone rejected twice already, now may be ready to break?
Fib reactions have been precise, so look for Break-n-Retest

MSFT at Gamma Wall Crossroads–Will 506 Break This Time? July 14🧠 GEX and Options Sentiment (TanukiTrade GEX)
* GEX Zone Summary:
* 📈 Call Wall 1 (503.5–506.7) → major Gamma Resistance.
* 🧱 Gamma Wall (506.77) = Highest positive NETGEX — key sell zone for market makers.
* 🟢 GEX Flow: Moderate call dominance (1.95%) — not yet extreme bullish.
* 🟣 IVR 22.8 (low), IVX avg 25.2 – implied vol remains subdued.
* Options Suggestion:
* ⚠️ A move above 506.8 could trigger dealer hedging and gamma squeeze.
* Trade Idea (Bullish):
* Buy 510C or 515C (Jul 19/Jul 26 expiry) on breakout above 507 with volume.
* Stop: <503. Target: 512/516.
* 🚨 If rejection at Gamma Wall (506.8), fade the move:
* Trade Idea (Bearish):
* Buy 500P or 495P on rejection or candle close below 503.
* Target: 497.8 / 494. Stop: 506.5.
📉 1H Technical Trading Plan (Smart Money Concepts)
* Structure:
* Price made CHoCH → BOS toward 506 zone, now consolidating below resistance.
* Minor rejection seen from inside the purple supply box at 506.
* If bulls hold 501–503 zone, could be prepping a second push.
* Key Levels:
* Support: 501.48 / 497.78 / 494.11
* Resistance: 504.46 / 506.77
* Bias:
* 🟢 Bullish above 504.50, expecting breakout toward 510–512.
* 🔴 Bearish below 501.5, likely drop toward 497.8–495.
* Intraday Trading Setup:
* Scalp Long: Entry 504.5–505. Breakout candle confirmation.
* TP: 507. SL: 503.8
* Scalp Short: Entry <501.3
* TP: 498, SL: 503
* Swing Trade Scenario:
* Enter swing calls above 507. Hold for 515+ next week.
* Enter puts only if breakdown below 497.8 with CHoCH back down.
🎯 Final Thoughts:
MSFT is trading tightly below a significant GEX Call Wall, which often leads to a volatile breakout or strong rejection. If bulls push through 507+, we could see a sharp gamma squeeze into 510–515. However, if this fails, price may fade back toward 495–490 zone quickly. Patience at resistance is key.
Disclaimer: This analysis is for educational purposes only and does not constitute financial advice. Always do your own research and manage risk appropriately.

Microsoft hits record highs days before earnings dayMicrosoft Corporation (symbol ‘MSFT’) share price reached a new all-time high on July 17 at $511.70 while on July 18 it even reached $514.64 intraday. The company’s earnings report for the fiscal quarter ending June 2025 is expected to be released on Wednesday, July 30th, after market close. The consensus EPS is $3.35 against $2.95 of the same quarter last year.
Microsoft is still holding its higher market cap compared to its main competitor, Apple, with $3.75 trillion against $3.02 trillion. Recently, Microsoft’s web-based platform “SharePoint” was hijacked, with Microsoft quickly reacting with patches to resolve the issue. As of today, there was no significant effect on the share price, but as the story unfolds, we might see some market reaction.
Technical analysis shows that the price has found sufficient support on the lower band of the Bollinger bands in early April and has since entered a rather aggressive bullish rally until the day of this report being written. As a result of the bullish rally, the Stochastic oscillator has been pushed to extreme overbought levels and has recently corrected to neutral levels, hinting that the price could move in either direction in the near short term. On the other hand, the moving averages are still validating an overall bullish trend in the market while the Bollinger bands are quite contracted, showing that volatility has dried up, and it might take some time to witness any significant moves.

Microsoft from 2000 to 2017 - Ranging Moments - 13/07/2025A lot of patience is required by Investors.
Stakeholders' Trust and good faith are required in company products & services. Also Board of Directors and Company Management play a big role in growing the company.
An amazing point I can notice,
During this period, Steve Ballmer was from 2000 to 2014.
The CEO plays a crucial role in determining the company's hard pocket returns for investors or the highest risk for investors.
After Stever Ballmer left his position, Microsoft did 10X in stock price.
From approx $50 to $500 within the period of 8 years only.
So What made Microsoft in ranging price points for that period?
Innovation?
Bad Choices of Acquisition?
If you have any good points to connect, comment down on this post?
Happy trading.

MSFT Charging Toward Resistance for July 10MSFT Charging Toward Resistance — What the Gamma Map Reveals for This Week’s Trading
🔍 GEX Analysis – Options Sentiment Outlook
MSFT’s current positioning reveals a relatively neutral options sentiment with slight bullish bias:
* GEX at $507.12 marks the highest positive gamma exposure and major resistance. It's also aligned with the 3rd CALL Wall and the Gamma Wall, making this level a magnet and a potential stall zone.
* Beneath price, multiple PUT walls form strong support between $487 and $490, with the final PUT Support down at $485.
* The HVL (High Volume Level) sits at $492.55, which now serves as an intraday support pivot.
* IVR is low at 21.6 and IVx avg is 22.2, showing little fear or demand for expensive protection, suggesting a stable grind rather than explosive moves.
📌 Options Strategy Suggestion:
* Bullish Setup: Use $500–$510 Call Spread (July 12 expiry) targeting the gamma wall at $507+. Entry is favorable as long as MSFT holds above $498.
* Neutral Setup: Consider Iron Condor between $490–$510 if price consolidates below $507.
📉 1H Technical Chart Insights
* MSFT recently confirmed a BOS (Break of Structure) after rejecting from the previous supply zone, now attempting to build a bullish continuation flag.
* A new demand zone has formed around $498–$500, which aligns with the GEX 2nd CALL Wall and short-term trendline support.
* Price is consolidating under the purple supply box, and a clean break over $503.50 could trigger a momentum run toward $507.12.
* Structure still holds a bullish bias as long as MSFT remains above the $496–$498 confluence zone, supported by prior CHoCH, trendline, and OB zones.
🧭 Trading Outlook
* Bullish Scenario: Break and hold above $503.50 could trigger a fast move toward $507–$510. Ideal entry: $502.50–$503. Stop-loss: Below $498. Target: $507.
* Bearish Rejection: If MSFT rejects at $503.50 and breaks below $498, it may revisit the demand zone at $492. Ideal PUT entry: break below $496. Target: $490.
Conclusion:
MSFT is sitting just under heavy gamma resistance with demand stacked below. Traders can prepare for a breakout continuation toward $507+ or a fade from resistance into $498–$492 support zone. Use options spreads or short-term directional plays based on the breakout or rejection setup.
This analysis is for educational purposes only and does not constitute financial advice. Always manage risk and confirm your setups before entering trades.

MSFT Correction then to 504?Morning everyone
Currently we are seeing a possible correction to the 495 zone with a possible break to the upside to 504 is what we are currently seeing.
Trade Smarter Live Better
Kris/Mindbloome Exchange

MSFT at Decision Point: Options GEX & Smart Money Clues🧠 Options GEX Analysis – Bullish Bias Above 497.5
* Gamma Wall / Resistance at 500–502.5
There is clear call resistance at 500.79, aligning with heavy GEX levels at 502.5 and 507.5, with the 2nd Call Wall peaking at 74.58%. This sets a magnetic zone IF MSFT pushes above 498.
* Below 490 = Risky Territory
The HVL support zone (07/11) sits at 490. A breakdown below this may open up weakness toward 485 (2nd PUT Wall at -28.77%) and even 480 where heavy PUT support lies at -38.11%.
* Implied Volatility & Sentiment
* IVR: 25.4, IVx avg: 23.9 → Moderate volatility
* PUTs: 4.9% bias, GEX: Bullish (🟢🟢🟢)
This leans bullish short-term, but caution is advised on a break under 490.
📉 1-Hour Chart Insights – Price Action + SMC
* Structure:
BOS and CHoCH confirmed. Price pushed above structure but is now consolidating below 500, suggesting indecision.
* Fair Value Gap + Order Block Retest
The recent CHoCH is forming near 500, and price is reacting to the purple SMC zone. Price is holding above the bullish OB and BOS zone around 480–488. This is key demand.
* Trend:
As long as price stays above the SMC bullish OB and GEX support at 490, a potential continuation toward 502.5–507.5 remains valid.
📌 Game Plan / Suggestions
Bullish Setup:
* Entry: Above 498–500 breakout
* Target: 502.5, 507.5
* Stop: Under 490 or conservative at 488
Bearish Setup:
* Entry: Below 488 break
* Target: 485, then 480 PUT zone
* Stop: Above 492
Watch the opening range – if MSFT gaps above 498 with momentum, bulls could dominate. But failure at 500 means this could fade back into the OB zone.
🎯 Final Thoughts
This is a make-or-break zone for MSFT — smart money has positioned resistance at 500+ while GEX still supports upside bias above 490. Stay nimble.
Disclaimer: This analysis is for educational purposes only and does not constitute financial advice. Always do your own research and manage risk.

Microsoft (MSFT) 4H Buy Signal – Rocket Booster Strategy🚀 Microsoft (MSFT) 4H Buy Signal – Rocket Booster Strategy Activates on Gap-Up, Volume Spike, and Stoch RSI Reversal 📈
-
Microsoft (MSFT) has just triggered a compelling buy signal on the 4-hour chart, with multiple layers of confluence aligning to
-
support a bullish continuation. This setup fits perfectly into what I call the Rocket Booster Strategy — a system built to catch strong
-
upside moves right before they ignite.
-
Here’s what’s happening on the chart:
-
1. High Volume on the 4H Entry Candle
We’re seeing an above-average volume spike on the recent bullish 4H candle,
-
which tells me there’s strong participation behind the move — possibly institutional activity. High volume at key price levels
-
often acts as the first stage of a breakout acceleration.
-
2. Stochastic RSI Reversal from Oversold
-
The Stochastic RSI has curled back up from below the 20 line, printing a clear buy signal.
-
This reversal suggests that upward momentum is returning just as price confirms strength — a powerful combination.
-
3. Price Trading Above Both the 50 EMA and 200 EMA
-
MSFT is now well above the 50 EMA and 200 EMA on the 4-hour chart.
-
This alignment confirms a strong underlying trend. When price is supported by both short- and long-term moving averages,
-
it's a green light for trend-following strategies.
-
4. Bullish Gap-Up
-
The session began with a bullish gap-up, which acts like a "booster rocket" for momentum.
-
Gaps on tech stocks like Microsoft often attract short squeezes and breakout buyers
-
— this one could be the start of a new leg higher.
Strategy Context: Why This Setup Matters
-
The Rocket Booster Strategy works best when these four elements align:
-
Volume spike
Momentum reversal
EMA trend structure
Gap-up catalyst
-
With Microsoft showing all four in perfect sync, this becomes a high-probability continuation entry.
-
Trade Idea (Not Financial Advice)
-
Entry: Current 4H candle close or next retracement
Stop Loss: Just below the gap or the 50 EMA
Target: Previous swing high and extended target based on Fibonacci expansion
-
Final Thoughts
-
Microsoft rarely gives such clean setups, and when it does, it pays to watch closely. If momentum continues, this could set the tone for the rest of the week.
-
Always manage risk — no rocket launches without backup systems.
-
Let me know if you’re trading this setup too or have your own spin on the strategy. Feedback and chart ideas welcome!
Rocket booster engaged for MSFT? 🔥
Rocket Boost This Content To Learn More
Disclaimer:
This analysis is for educational and informational purposes only. It does not constitute financial advice or a recommendation to buy or sell any security.
Always do your own research and consult a licensed financial advisor before making any trading decisions. Trade at your own risk.

$MSFT: A Teflon stock turning hot, will it catch fire? Before you wonder why we call it a Teflon stock please check my blog on 27 April 2025.
NASDAQ:MSFT : A 'Teflon' stock refusing to budge under pressure for NASDAQ:MSFT by RabishankarBiswal
I pointed out the reason why this stock refused to go down below critical levels and held onto some impressive gains. And since then, we have rallied 33% from the lows of 360 and reached an ATH of 480 $. The buying pressure on the stock has pushed it above our upward sloping parallel channel which we have been following for more than 2 quarters. We always argued that the stock has support around 350 $ and is unlikely to break the support. We bounced back exactly 350 $ with 25 RSI indicating oversold conditions.
Currently with stock price above 480 $ the RSI looks over bought at 73. But in my opinion the bull run can continue for some more time unless we see a double top in the RSI just like in 2022 and 2024. Double tops usually result in breakdown. But until then there is a lot of runway ahead of us. If we plot the Fib extension levels from the top before Liberation Day to the bottom after the liberation day, then we see that the next level on the chart is 1.612 Fib level with a price of 542 $. NASDAQ:MSFT is a Teflon stock which is hot but might not catch fire and go to the moon. 😊
Verdict: More potential upside in $MSFT. Near term target 542 $.

MSFT at a Key Spot–Rejection or Rebound? Here’s the Trade SetupGEX-Based Option Outlook:
The GEX chart reveals strong support around 487.5, with the highest positive NetGEX zone at 491.5. This is the “Gamma Wall” — market makers likely defending this level. Below that, heavy PUT support is stacked around 485, signaling hedging flow that could act as a floor. IVR is sitting at 21.5, and the PUT% is 3.2%, suggesting relatively cautious sentiment.
→ Call buyers can consider 495C or 500C for a bounce if MSFT holds this zone — ideally for a short-dated scalp if 492.5 reclaims and confirms.
Price Action (1H) Intraday Analysis:
MSFT sold off into a key SMC demand zone, now stabilizing inside the green OB box just above 487.5. We saw a CHoCH (Change of Character) and Break of Structure confirming weakness, but the last candles suggest deceleration in selling.
There’s also a previous supply zone at 497–500 which is likely to reject price on the first retest. A lower high could print there if bulls step in early.
Trade Ideas:
Scenario 1 – Long (Reclaim and Bounce):
* Entry: Above 492.5
* Target: 497 → 500
* Stop: Below 487.5
* Reason: Reclaim of key GEX resistance + bounce from demand zone + volume tapering on dip
Scenario 2 – Short (Rejection):
* Entry: Near 497–500 if tapped fast
* Target: 487.5 → 485
* Stop: Above 501
* Reason: GEX call wall + previous SMC BOS zone + weak structure on pop
Thoughts:
MSFT looks weak on momentum, but it’s sitting on a gamma and SMC confluence zone. If bulls are going to defend this, they need to do it early tomorrow. Watch volume — low-volume grind higher is ideal for a long scalp. Otherwise, fade any pop near 500.
Disclaimer: This is not financial advice. Do your own research and manage your risk.

MSFT - Negative Bubble (Short term Buy Cycle) MSFT
Short Term Buy Cycle
TP@498.27
% bubble ratio
Currently in a short term buy cycle with fair value at 498.27
Spot trading plan:
Start to buy from (-10%) bubble ratio and below

Velocity Market Conditions Explained.There are 6 primary upside Market Conditions. Currently the stock market is in a Velocity Market Condition where price and runs are controlled by retail investors, retail swing traders, retail day traders and the huge group of Small Funds Managers using VWAP ORDERS to buy shares of stock with an automated systematic buy order trigger when the volume in that stock starts to rise. The more volume in a stock the faster the VWAP order will trigger.
You task is to study Dark Pool hidden and quiet accumulation bottoming formations to be ready for the Velocity Market Condition that always follows.
Price is a primary indicator.
Volume is a primary Indicator.
These are the most important indicators in your trading charting software tools.
The next most important indicator is Large lot versus Small lot indicators which are NOT based on volume but more complex formulations.
HFTs use algorithms, AI, social media discussions etc.
To ride the Velocity wave upward, you must enter the stock before the run upward.
Learning to read charts as easily takes practice and experience.
The benefit is the ability to forecast with a very high degree of accuracy what that stock will due in terms of rising profits, over the next few days or longer.
Candlesticks have many new candle patterns that have just developed in the past couple of years. The stock market is evolving at a fast pace and the internal market structure that you can't see is only visible in the candlesticks, large lot vs small lot indicators, and other semi professional to professional level tools for analyzing stocks.
The stock market is changing and becoming far more tiered with more off exchange transactions. Learn to read charts so that you can trade with higher confidence and higher revenues.

$MSFT✅ NASDAQ:MSFT trading up to $500/share
If investors are willing to pay that, it usually reflects:
Strong earnings growth and outlook
Confidence in expansion into high-demand sectors (AI, cloud, cybersecurity)
The sense that Microsoft has durable “moats” meaning customers and other systems are increasingly dependent on their software and infrastructure

MSFT GEX Levels Say “Still Room to Run!”—Here’s the Trade Setup
Alright, traders, MSFT is showing some juice left in the tank based on today’s GEX profile.
💥 GEX & Options Sentiment
* GEX is positive with 9.95% call support, IVR at 1.7 (still low), and IVX dropping slightly. This gives the greenlight for calls if the breakout holds.
* Big GEX magnets sit near 492.5 → 497.5 → 500. That 500 level aligns with the 3rd call wall and is the key magnet if bulls take charge.
* As long as we stay above 485, we’re in a favorable zone supported by 39–50% GEX brackets.
📈 Best Option Trade Idea (Short-Term):
Consider 495C or 500C (0DTE or 2DTE) on any breakout above 492.5 with volume confirmation.
SL = below 485
TP = trail into 497.5 and partials before 500.
🔎 Chart View + Price Action Notes (1H)
From the second image:
* MSFT broke structure cleanly with multiple BOS and CHoCH confirmation. It’s consolidating in a bullish flag under 492.5.
* Volume stayed decent even during the flag, suggesting accumulation.
* Purple zone = liquidity pocket or SMC supply → break of that zone will unlock the 495/497 levels fast.
🚨 Trade Plan:
* If MSFT breaks above 492.5, enter with momentum. Use 485 as your invalidation zone.
* If it dips to 486–485, look for a bounce/retest entry for a better risk-reward.
Bias: Bullish
Trigger: Break of 492.5 or retest of 486 support
Target: 497.5 → 500 GEX wall
Stay sharp — follow the GEX, not the noise. 📊
This content is for educational purposes only and is not financial advice. Always DYOR and manage your risk.

Microsoft Wave Analysis – 24 June 2025- Microsoft broke the resistance area
- Likely to rise to the resistance level 500.00
Microsoft recently broke through the resistance area between the resistance levels 468.15 (a former multi-month high from the middle of 2024) and 455.85 (which reversed wave B in December).
The breakout of this resistance area accelerated the active minor impulse wave 5 – which belongs to the intermediate impulse wave (3) from April.
Given the clear daily uptrend, Microsoft can be expected to rise to the next round resistance level 500.00 (target for the completion of the active impulse wave 5).
