“Momentum Fading or Just Getting Started? What the Chart Says AbMotorola Solutions (NYSE: MSI) recently reported strong Q1 2025 earnings on May 1, beating both revenue and EPS expectations. Despite the solid numbers, the stock has shown technical weakness, dropping sharply after earnings. This divergence between fundamental strength and technical bearishness creates a strategic window for both bullish and bearish options traders.
1. Technical Analysis
Pattern Recognition
After stripping away external annotations, the raw chart reveals:
• Double Top Formation near the $439 area — a classic bearish reversal signal.
• Sharp Breakdown post-top with significant volume.
• Bear Flag forming — a potential continuation pattern that often precedes another leg down.
Price Action
• Current Price: ~$412
• Short-Term Trend: Bearish
• Volume: Elevated during breakdown — confirms sellers in control
• No Bullish Reversal Yet: Price hasn’t reclaimed any major resistance zones
3. Options Strategies (1-Month Outlook)
Bearish Strategy: Put Option Play
Rationale: The breakdown from a double top and potential bear flag indicate more downside is possible.
• Strategy: Buy 1x MSI $410 Put
• Expiration: June 21, 2025
• Premium (Est.): $8.85
• Breakeven: ~$401.15
• Risk: Limited to premium paid
• Reward Potential: High if price breaks below $410 and continues to $400 or lower
Best for: Traders who believe technical pressure will outweigh strong fundamentals in the short term.
Bullish Strategy: Call Option Play
Rationale: Despite technical weakness, the fundamentals remain solid. Earnings beat, record cash flow, and software expansion could support a rebound—especially if macro fears ease.
• Strategy: Buy 1x MSI $420 Call
• Expiration: June 21, 2025
• Premium (Est.): $1.54
• Breakeven: ~$421.54
• Risk: Low cost, limited to $1.54 per share
• Reward Potential: High if price breaks and holds above $420
Best for: Traders who expect a bounce based on fundamental strength or oversold conditions.
4. Final Recommendation: Watch for Confirmation
Given the mixed signals:
• Short-term trend is bearish, but fundamentals are strong.
• Look for confirmation:
• If price breaks below $408, consider the put strategy.
• If price reclaims and holds above $420 with volume, the call play becomes more attractive.
5. Risk Management Tips
• Set stop-losses or alerts at key price levels ($408 and $420).
• Don’t overleverage — especially with options.
• Monitor upcoming macroeconomic headlines (inflation, tariffs, Fed decisions).
MSI trade ideas

Motorola Solutions May Rise to 475.00-480.00 (READ DESCRIPTION)Motorola Solutions May Rise to 475.00 - 480.00
Pivot Point: 446
The pivot point at 446 serves as a significant support level. Maintaining above this level indicates a bullish outlook, suggesting potential for upward movement. A breach below this level could signal a change in market sentiment, leading to bearish pressure.
Primary Strategy (Our Preference):
Entry Point: Seek long positions as long as the price stays above the pivot point of 446.
Target Levels:
475.00: This target represents a substantial upward movement, reflecting confidence in the stock's potential to capitalize on bullish momentum.
480.00: A further target that reinforces the positive outlook, suggesting a continuation of upward price movement.
Alternative Scenario:
If the stock drops below the pivot point at 446, traders should consider short positions.
Entry Point: Initiate short positions if the price breaks and sustains below 446.
Target Levels:
437.00: The first downside target, indicating a level where buying interest might emerge, but selling pressure could continue if bearish momentum strengthens.
432.00: The next target suggests further declines, reflecting a potential bearish trend if the stock continues downward.
Technical Outlook:
RSI Indicator: The RSI is above 70, indicating that the stock may be in a strong uptrend but also suggesting it could be overbought. This could lead to a potential correction if bearish divergence is observed.
MACD Indicator: The MACD is positive and below its signal line, indicating that while the current trend remains bullish, there may be a short-term retracement or consolidation in price.
Moving Averages: The stock is trading above both its 20-day and 50-day moving averages (respectively at 445.72 and 431.28), confirming the bullish trend and reinforcing the potential for upward movement.
Market Dynamics:
As long as Motorola Solutions holds above the pivot point of 446, the potential for price increases toward targets of 475.00 and 480.00 remains robust.
However, if the price falls below the pivot, market sentiment could shift, leading to potential declines toward support levels of 437.00 and 432.00.
The pivot point at 446 is critical for maintaining a bullish outlook for Motorola Solutions. Holding above this level opens possibilities for upward movement toward 475.00 and 480.00.
Current technical indicators support a bullish sentiment, but traders should monitor for signs of potential retracement, especially if the price breaches the pivot support.

Randomly entered the MSI upwards trendA few days ago, I entered a long position in $MSI. The sideways correction that lasted most of September seems to have been broken. The upward impulse was followed by a correction over the last few trading days, making it appear to be a good position to enter the trade.
The bullish trend has been ongoing for several months, with the SMAs beautifully aligned. I expect bullish action in October, before some instability may arise in the market with the upcoming earnings report for NYSE:MSI , the presidential election, and the FED announcement.

Bulls want to see bulish momentum on $MSIBulls are watching NYSE:MSI (Motorola Solutions Inc) closely. It formed a Weekly Inside Bar, signaling potential consolidation before a breakout. Friday's daily hammer candle hints at bullish momentum building. Bulls could expect more upside next week if momentum continues.

Motorola Solutions, Inc.
The volume bars show higher-than-average volume on the last trading day, which may suggest increased interest or potential breakout/breakdown.
Rising price with increased volume typically confirms the strength of an uptrend.
Uptrend: The price has been in an uptrend since early 2024, forming higher highs and higher lows. The Bollinger Bands have been expanding during the uptrend, signaling increasing volatility.
Consolidation: Recent price action suggests consolidation after the latest uptrend. The price seems to be stuck near the upper Bollinger Band, with some retracement or hesitation around the $440–$450 range.
Resistance: Around $448–$450, where the price has struggled to break higher.
Support: Stronger support around $420, which aligns with the middle Bollinger Band and previous price action in August.
The stock is in a broader uptrend, but it is currently in consolidation. A break above $450 could signal a continuation of the uptrend. A break below $420 may suggest a deeper retracement towards the next support levels.

MSIMotorola Solutions, Inc. is an American video equipment, telecommunications equipment, software, systems and services provider that succeeded Motorola, Inc., following the spinoff of the mobile phone division into Motorola Mobility in 2011. The company is headquartered in Chicago, Illinois.
Strong price action below resistance.

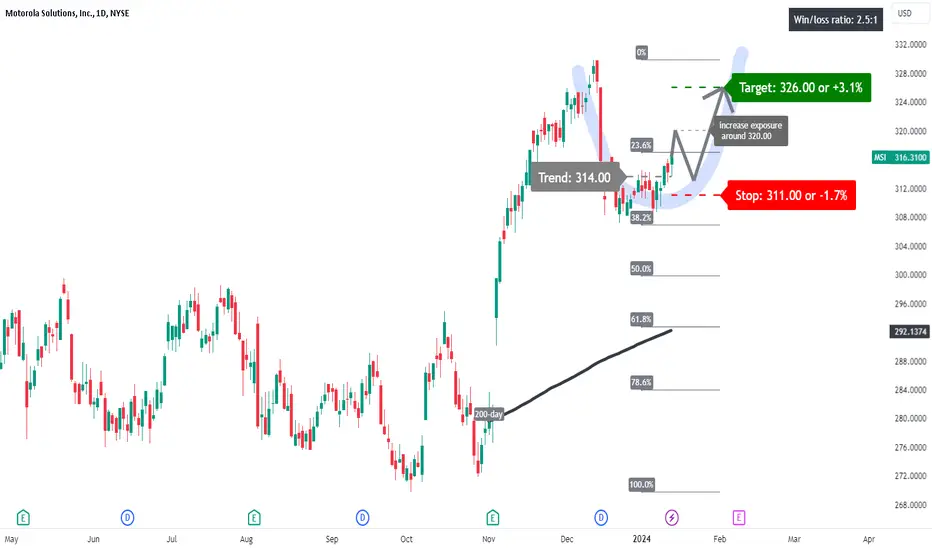
MSI: U-shaped pattern?A price action above 314.00 supports a bullish trend direction.
Expect further upside potential for a break above 320.00.
The target price is set at 326.00.
The stop-loss price is set at 311.00.
The U-shaped pattern observed in the price chart may imply a potential for further upward movement in prices. This pattern, often seen as a sign of market recovery or bullish sentiment, suggests that after a period of decline or consolidation, there is a likelihood of price increases as the pattern completes its formation and trends upwards
Motorola... Time to cut your connection ??Motorola (MSI) has performed very well in the past 3 weeks, tacking on nearly 18%.
This was probably due to earnings expectations (they beat estimates) and an 11% dividend increase.
The shares currently yield 1.23%.
Interestingly, the stock price has formed a bearish harmonic crab formation on the 4h chart, and simultaneously a bearish harmonic butterfly formation using RSI as input (insert).
Note: crab patterns can go on longer than expected.
So caution holders of long positions and of the start a possible shorting opportunity.
Targets are marked on the chart.
I will follow up and advise further if I feel a short position is warranted.
As always do your own due diligence and watch the overall market direction for confirmation.
This is not investment advice.
S.
Motorola... Time to cut your connection ??

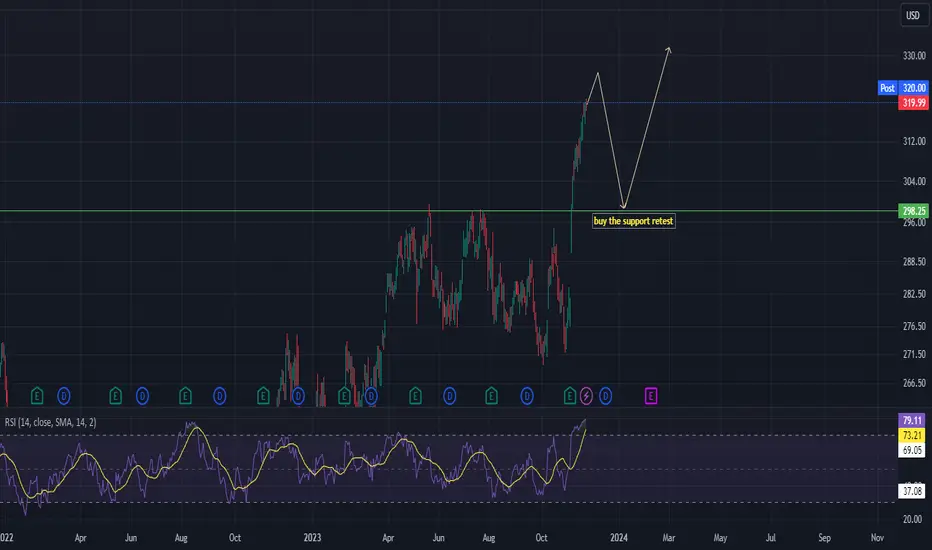
MSI overbought but still stronghi Traders
How are you?
MSI has been bullish since June 2022. Now, we can observe the highest level of Motorola ever since. As RSI indicates, an overbought conditions, which may be a sign that the pullback is around the corner.
As the price is making new ATH and the trend is very bullish overall and there's no any bearish divergences yet, we are not going to try being a hero and try to catch the top therefore we recommend to play the trend continuation and enter the long after getting the pullback/correction.
Buy the horizontal support around 298 $
Motorola (NYSE: MSI) Earnings Report Could Park a SpikeMotorola Solutions, Inc. MSI reported strong third-quarter 2023 results, driven by the diligent execution of operational plans and healthy growth dynamics backed by solid order trends. Both adjusted earnings and revenues surpassed the respective Zacks Consensus Estimate. In addition, Motorola achieved record third-quarter revenues, earnings, cash flow and backlog, which further exemplified the strength of its portfolio. The company expects this growth momentum to continue in the near term on robust demand patterns.
Net Earnings
On a GAAP basis, net earnings in the third quarter were $464 million or $2.70 per share compared with $279 million or $1.63 per share in the year-earlier quarter. The year-over-year improvement was primarily attributable to top-line growth and lower cost of sales.
Excluding non-recurring items, non-GAAP earnings in the quarter were $547 million or $3.19 per share compared with $514 million or $3.00 per share in the year-ago quarter. The bottom line beat the Zacks Consensus Estimate by 17 cents.
Revenues
Quarterly net sales were record high at $2,556 million, up 7.7% year over year, with solid sales in both segments across all regions driven by the strength of its business model and the value of its mission-critical integrated ecosystem. The company witnessed strong demand for video security, command center software and LMR (land mobile radio) services. The top line beat the consensus estimate of $2,516 million.
Region-wise, quarterly revenues were up 5.7% in North America to $1,783 million due to growth in LMR, command center software and video security products. International revenues were up 12.7% to $773 million, with growth in video security products, LMR and command center software. Acquisitions contributed $19 million to revenues, while foreign exchange tailwinds were $13 million.
Segmental Performance
Net sales from Products and Systems Integration increased to $1,612 million from $1,529 million in the year-ago quarter, driven by higher demand for LMR and video security solutions. It also exceeded our revenue estimates of $1,552 million. The segment’s backlog was up $62 million to $4.9 billion, primarily due to high LMR demand in North America.
Net sales from Software and Services were up 11.8% to $944 million, with solid performance across command center software, LMR and video security services. However, the segment revenues missed our estimates of $962.8 million. The segment’s backlog increased $702 million to $9.4 billion, primarily due to higher multi-year software and services contracts in North America and favorable currency impact, partially offset by revenue recognition for the Airwave contract.
Other Quarterly Details
GAAP operating earnings increased to $639 million from $373 million in the prior-year quarter, while non-GAAP operating earnings were up to $741 million from $676 million. The company ended the quarter with a record backlog of $14.3 billion, up $764 million year over year.
Overall GAAP operating margin was 25%, up from 15.7%, while non-GAAP operating margin was 29% compared with 28.5% in the year-ago quarter. The increase in GAAP operating margin was primarily due to higher sales.
Cash Flow and Liquidity
Motorola generated $714 million cash from operating activities in the reported quarter compared with an operating cash flow of $388 million a year ago. Free cash flow in the third quarter was $649 million. The company repurchased $322 million worth of stock during the third quarter. As of Sep 30, 2023, MSI had $910 million of cash and cash equivalents with $4,704 million of long-term debt.
Guidance Up
With solid quarterly results and robust demand patterns, the company raised its earlier guidance for 2023. Non-GAAP earnings for 2023 are currently expected in the $11.65-$11.70 per share range, up from $11.40-$11.48 on revenues of $9.930 billion to $9.945 billion, up from $9.875 billion to $9.900 billion estimated earlier, with a rise in both segments on higher demand.
For fourth-quarter 2023, non-GAAP earnings are expected in the $3.60-$3.65 per share range on year-over-year revenue improvement of approximately 4% due to healthy demand trends.
Moving Forward
Motorola is poised to gain from disciplined capital deployment and a strong balance sheet position. The company expects strong demand across LMR products, the video security portfolio, services and software while benefiting from a solid foundation.
Price Momentum
MSI is trading near the top of its 52-week range and above its 200-day simple moving average. Investors have been pushing the share price higher, and the stock still appears to have upward momentum. This is a positive sign for the stock's future value.


🟩 $MSI - buying pilot positionGrabbing a pilot position into MSI (telco)
RS rating is lower 84/100
Industry group is lower 125/197

$MSI pullback setupPretty much exact setup as $DXCM, here is $MSI doing the same thing and setting up pullback buy.

Nen-StarThe Nen-Star pattern is Bearish.
Crooked W.
Valley 2 is lower than valley 1.
Last leg appears to have landed at the 1.272.
It looks like MSI was in the midst of forming a Bull Flag and the CPI report may have interrupted it's completion.
Watching for now.
Price is still above the .236 fib level of the long trend up.
Strong stock.
No recommendation.
ATH 273.65

MSI - Cup and Handle Cup and Handle pattern on the side on this daily timeframe
The neckline can be seen to be acting diagonally against the cup and handle, which to me satisfies the rules of a cup and handle

MSI - Climb Above Major Trend Line Similar positions in Green circles
Potential for a rise that was seen in the earlier green circle, pushing price above the Major Trend line by a lot
There is a sneaky double bottom in both cases (dotted line)
The big Chart pattern is a Descending Broadening Wedge

Motorwala USA Sun Storm Investment Trading Desk & NexGen Wealth Management Service Present's: SSITD & NexGen Portfolio of the Week Series
Focus: Worldwide
By Sun Storm Investment Research & NexGen Wealth Management Service
A Profit & Solutions Strategy & Research
Trading | Investment | Stocks | ETF | Mutual Funds | Crypto | Bonds | Options | Dividend | Futures |
USA | Canada | UK | Germany | France | Italy | Rest of Europe | Mexico | India
Disclaimer: Sun Storm Investment and NexGen are not registered financial advisors, so please do your own research before trading & investing anything. This is information is for only research purposes not for actual trading & investing decision.
#debadipb #profitsolutions

I Like Big Bases and I Can Not Lie!!!I can't help myself. I love big base breakouts and they're everywhere. Here's a whole list of stocks that are either breaking out of long term bases or testing long term inflection points. Use multiple time frames to find the bases. Most of them can be found on weekly and monthly charts. Here's the link to the watch list: www.tradingview.com

MSI breaking out of a cup and handle pattern* Exceptional earnings year-over-year
* Very strong up trend
* High relative strength in the Tech sector
* Pays out dividends
* Breaking out of a cup and handle with higher than average volume
Trade Idea:
* Now's the perfect time to get in as the price is very close to the broken level
* Looking at the weekly char also gives a lot of confidence that this is ready to move higher
* The price right now is giving a very favorable risk/reward ratio.


