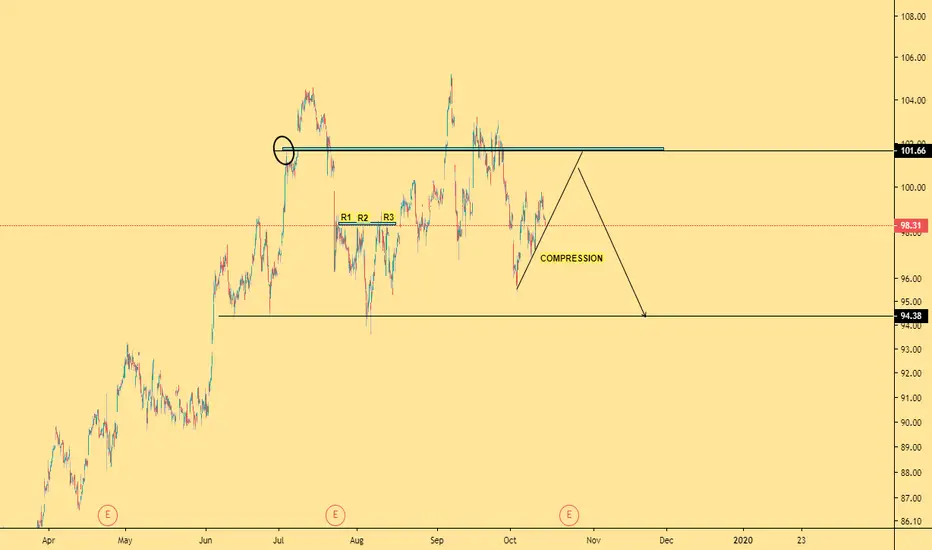
NASDAQ - Resistance reached!Currently NASDAQ showing lag of bearish momentum along with reaching important resistance which suggests that we will see a correction the forthcoming days.
Good luck!
--------------------------------------------------
Short market @ 102.48
Stop-loss @ 105.55
Target 1 : 95.68 — R/R ratio: 2.21
NDAQ trade ideas

NASDAQ: False Breakout and Bearish Forecast
hey traders,
I have noticed a very peculiar thing on NASDAQ.
on the price chart, I compare with you the market sentiment in 2018 and 2019.
I like the similarity in price action and the fact that both consolidations have started in summer and after a strong bullish impulse.
Though similarities do not give us a 100% chance, I still believe that we can apply it in our analysis and it lets us be skeptical about further bullish continuation, no matter how media praises the growth.
Share with me your thoughts!

What to do now with Nasdaq?Price is now kind of stuck in a symmetrical triangle pattern where it could hit either way, up or down. For it to go up higher, the price must close above 104.57 which I think it will.
Another possibility is it could also hit lower first before trending higher. That would means it would hit 102.85 as the first support. If this support level holds, then we can expect it to continue its upward trend.
The usual rules apply - the higher level you buy, you must be prepared for correction, which means suffering a temporary loss. Staring at your portfolio in the red is not a good feeling and that itself can make traders do illogical thing like cutting their loss only to see the next few days, it went the opposite direction.
So, if you want to buy, wait for it, don't just rush for it. Stay safe in the game!

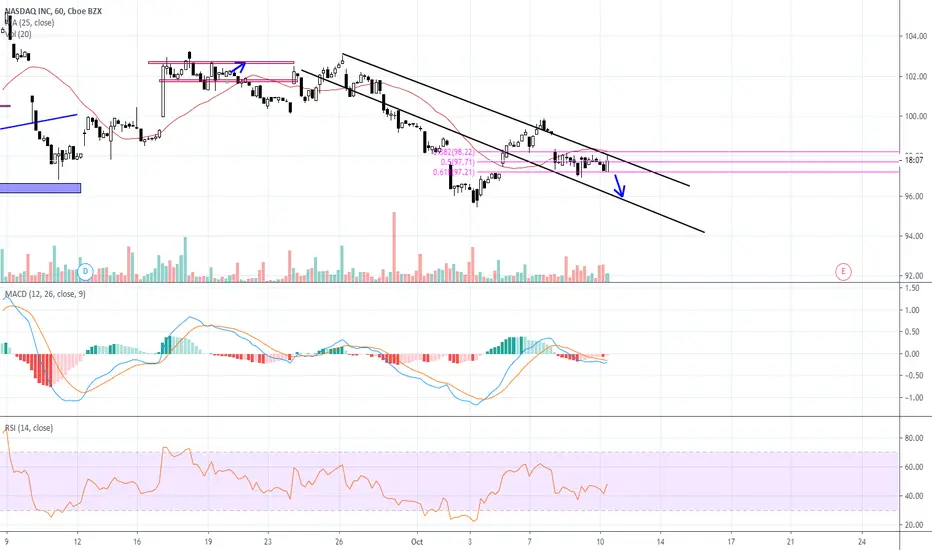
Short on the 4h timeframeLooking at the previous instances in the last 6 months that RSI has been this overbought, everytime it has immediately had a sharp dip.
One concerning factor is the delay how it has consolidated now for a few semi-tight closes but the R/R ratio 4/1 compensates for that.
Price target 1 if it reversed would be the point of control, although another more ambitious target would be waiting for the RSI to get oversold.

DOW Dumping9 Candle showing a sell on Friday, 20 SMA crossed up on 21 EMA, 3 candle Doji! Target 27500. Min 27981

NASDAQ: FEAR > (GREED + HOPE) ==> CORRECTION.In this screencast I set out why I think the NASDAQ is in deep trouble and uncertainty. This is truly beyond technical and fundamental analysis.
I'm looking into the psychology of markets. There is a whole lot to fear in this market. Reality is catching up on fantasy. It's been a long lovely dream and the big boys have made their killing. They will not want this to turn into a nightmare!
I explore patterns that today, are pretty similar to 2007-ish
I show why I think the market is exhausting. I say that quite possibly fear may outweigh greed and hope.
So the equation in a superheated bull market is:
FEAR > (GREED + HOPE) ==> CORRECTION.
DISCLAIMERS: This is speculative opinion only. That the post is listed as short is only an indication of probability estimate for the south. It is not intended to cause fear or to advise people on making financial decisions. Your decisions are your own as well as the risks you accept. If you lose out on profits or otherwise lose money, kindly sue yourself!


Hindenburg omen and US stock market crashWe continue writing a series of posts on the possible collapse of the US stock market. We have already written about the gigantic gap that formed between the growth rate of the US stock market (especially its technological sector) and the growth rate of the country's economy. This is a classic example of the formation beginning of a price bubble, which, at the end - collapses.
Today we’ll talk about a specific indicator of the onset of the crisis, the “Hindenburg Omen”. The indicator is named after the disaster of the German airship Hindenburg, which crashed in the American city of Lakehurst in 1937.
The essence of the indicator is that it monitors the ratio of the number of securities that updated 52-week highs to the number of securities that show 52-week low. That is, part of the securities is decreasing in price, while a part is growing. The increase in the number of securities that fall in aprice above a certain mark (a fraction of the total number of shares) is a rather alarming signal (such signals are called "Hindenburg exchange"), which may indicate the stock market’s collapse.
The “Hindenburg Omen” signals not only about a change in the market phase from bullish to bearish, but about the upcoming stock market crash. Each significant sale in the US stock market over the last 30 years has been preceded by the appearance of “Hindenburg Omen”.
The classic identification criteria for the Hindenburg Omen are as follows:
1. The number of new 52-week daily highs and lows simultaneously exceeds a certain threshold (2% -3% of the total number of companies in the listing), with the number of highs is lower than the number of lows
2. The stock index is higher than it was 50 days ago (10-week yield is growing).
Recently, in the dynamics of the high-tech sector of the US stock market, “Hindenburg Omen” are increasingly found: the index shows historic highs, but less than half of the components of the index trade above their 52-week highs. Over the past 15 years, this has happened only twice: in 2007 and 2014.
That is, we have another signal in favor of the fact that the stock bubble in the US stock market may burst very soon.


NASDAQ: Triple Top???
morning traders!
NASDAQ is on its way to retest the market high the third time this year.
103.0 - 106.0 is a decent area of resistance and bets are high that we will see a retracement from it.
Target levels will be 100 and 96
*also note that the previous daily candle was quite strong
for this reason, it is preferable to wait for a confirmation before taking action.
no matter what is your approach is, stop should be strictly set above the underlined resistance area .

NASDAQ: Triple Top???
morning traders!
NASDAQ is on its way to retest the market high the third time this year.
103.0 - 106.0 is a decent area of resistance and bets are high that we will see a retracement from it.
Target levels will be 100 and 96
*also note that the previous daily candle was quite strong
for this reason, it is preferable to wait for a confirmation before taking action.
no matter what is your approach is, stop should be strictly set above the underlined resistance area.

CLO's quality low, the crisis closeIn one of our previous reviews dedicated to CLO (collateralized loan obligation), we noted a sharp decline in the quality of this instrument.
When an investor buys a CLO, he estimates the probability of non-payment for this instrument, based on the rating assigned by the leading credit rating agencies. The higher the rating, the lower the likelihood of challenge and profit, but the lower the return and the other way around.
So today, the share of CLOs which rating is close to pre-default rate (about 40%). Note that on the eve of the global financial crisis, the proportion of mortgage loans did not exceed 13%. But this was enough for the entire pyramid of MBS, CDO and CDS to collapse, almost destroying the entire global financial system.
There is a question, how it is possible to achieve such an “impressive result” with a relatively low level of problematic mortgage loans? The answer is rating agencies (RA).
In pursuit of profitability (the assessment of each financial instrument brings tangible income to RA), S&P, Moody’s and Fitch gave ratings that did not correspond to reality, significantly underestimating the actual size of the problems. The crisis of 2007-2009 showed how rotten the RA system is and how far they are in their assessments from the truth - a significant part of the investment-grade MBS and CDO, in fact, turned out to be “junk” papers. The RAs subsequently admitted that they assigned higher ratings to thousands (!) of mortgage-backed securities.
And that was not only one case. Rating agencies before made mistakes systematically. Incidents with Enron, WorldCom, Lehman Brothers and many others show that even companies that are on the verge of bankruptcy might have high ratings. For example, in spring 2008 at the height of the financial crisis, Lehman Brothers shares fell by 50% (!) Fitch and Moody’s assigned the company a rating and category A. Recall, that year in the autumn the company went bankrupt.
The underlying reason for that is money. Each rating is an income for a rating agency. But besides this, the rating is a rather powerful tool of influence, and from time to time the RAs use this (lower ratings scare off investors). For example, once, the German company Hannover Re refused to cooperate with Moody’s. In response, RA lowered the ratings of the company and it lost 175 million dollars in a few hours.
That is, 40% of problematic CLOs in the market represent only a part of distressed loans. In reality, the situation is much worse. The magnitude of the problem is hundreds of billions of dollars. Given that the global crisis base has already been prepared by the trade war, it is all about the “pull ring” and what will detonate the grenade. The CLO market may well pull that ring and as MBS, CDO and CDS in 2007 could lead to the development of the crisis.
The crisis, in turn, will provoke massive sales in the US stock market. Considering that the NASDAQ100 index has grown 8 times over the past 10 years, the shares of the US technology sector seem to be the best candidates for sales.


Simetric triangle NDAQ indexIn the following char we are seeing a combination of support and resistance lines that provides the information as a triangle.
Both lines can be place where it can be touched and for that matter can be a triangle pattern.
When we place our highes high on the price of the index we have to place our second point on the lowest low of the price (which both are getting closer of each other).
Then we close putin the third and fourth point on the second lowes and second highest. Forming our triangle. Which is consider a symmetric triangle because of the correlation of the lines (that are getting along).
in this case we can place an order of a long position.

Ascending Parallel ChannelIn the following chart we can observe that the trend still continuous from a really long time giving us a sign of a parallel channel.
Being the trend an upper trend we can place a ascending parallel channel.
Placing the resistance and support lines withing the paralel channel we can expect a long position on this pattern.

28 October 2019 - Nasdaq - Long - Falling Wedge - HPT Thank you to Lizette, (one of our loyal memberss) for bringing this trade into my attention.
Nasdaq has been forming in a Falling Wedge formation.
As the price approaches 3/4s of the apex, we can expect a breakout to the upside which will send the price higher.
For a trade, we have two ways to base our take profits.
1. At the top of the wedge formation (which doesn't give it much room).
2. The price range between the high and the low added to the high.
NOTE: HPT = High Probability Trade as the previous trend is up...

yep we going downlook at the old school stocks like exxon for the last 50 years !! mfi is doing stuff that it never has.scary

No brainer trade on NASDAQ. 1W chartNASDAQ looks very bad right now. Very nice opportunity to short the market.
Reasons
Second all-time high resistance retest.
Stops taken above resistance.
Bearish RSI divergence on 1W chart.
Beautiful R/R trading opportunity.
Strategy
R/R: 2.7 or 3.69
Entry: around 98.66
Stop loss: 106.18
Target 1: 78.05
Target 2: 70.79
Markets look pretty bad in my opinion and we MIGHT be due for a recession or a crash. Possibly a good time to take cash out stocks until we broke above all-time highs and found support there. Please take a look at my SP500 idea as well.

Bearish divergence on the M Chart, Rising Wedge brokenNothing else to say.... great time to get out before it's too late !!
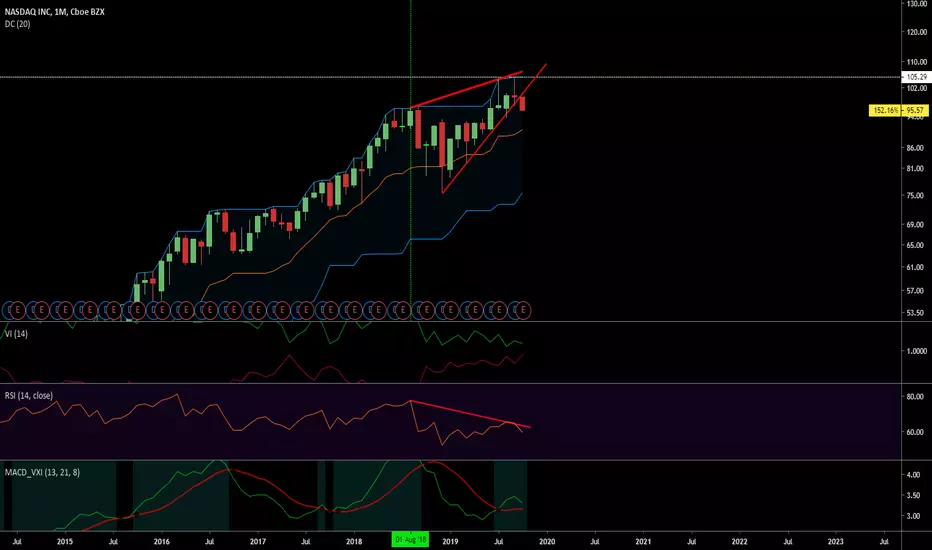
Big Correction probably happen for NASDAQ NASDAQ has been perfect uptrend for past few years.
Now It is making double top and rising wedge at the same time.
This is very decent trading set up.

