The 3 Reasons Why Netflix Stock Is A Good BuyIt has been one of the most stressful weeks of my life.
Filled with unexpected drama on my end.
Am trying to pass a medical exam so that
I can pursue a driving career. Thats my dream.But sadly
things are still in slow motion. Eventhough
pursuing a new dream has given me time to
reflect.Not only on my trading strategies, but also
on a personal level.
You need to write down and jorunal your
trades .This is what am doing.I am writing down all my
mistakes.And also my best trading ideas.
The 3 Reasons why am looking at this trade:
#1 - The Stochastic +RSI has crossed Below the
50 level - This shows you a divergence or in
other words a turning point.
#2 -The candle stick pattern you are seeing
is called: "The Northern Star" -This is a very bullish
candlestick pattern.
#3 -The main markets which include-
SP500
NASDAQ 100
Dow Jones 30
Are all going to trend upwards this coming week.
Word on the street is the Market is on fire🔥
The 3 Reasons NASDAQ:NFLX Is A Good Buy
This stock is following the rocket booster strategy
which has 3 steps as follows:
- The price is above the 50 Day Moving Average
- The pirce is above the 200 Day Moving Average
-The price is trending upwards.-In this case a bullish
candlestick pattern called the Northern Star .
This is how you find the best stocks to trade:Always look for
momentum.
In order to learn more rocket boost this content.
Disclaimer:Do not use margin.Trading is risky.Please
learn risk management and profit taking strategies.
Also feel free to use a simulation trading account
before you trade with real money.
NFLX trade ideas

Sombody block the sale on this trash company $NFLXNot me. Happens all the time in the markets. Gosh! This is too short to relay a message? Just updating my ideas jeesh!

Netflix - The bulls just never stop!Netflix - NASDAQ:NFLX - is insanely bullish now:
(click chart above to see the in depth analysis👆🏻)
The entire stock market basically collapsed during April. Meanwhile, Netflix is creating new all time highs with a +20% parabolic bullish candle. Looking at the chart, this strength is very likely to continue even more until Netflix will (again) retest the upper resistance trendline.
Levels to watch: $1.400
Keep your long term vision!
Philip (BasicTrading)

NFLX Great Long Term but Risky Shorter Term NASDAQ:NFLX
Looks riskier shorter term due to confluence resistance, but not impossible to see larger breakout here.
Longer term (2027-2028) $5,000 price target.

NETFLIX BEST SHORT OPPORTUNITY NASDAQ:NFLX – Short Setup Based on Broadening Triangle Pattern
Netflix has reached the upper boundary of a broadening triangle pattern, signaling potential exhaustion. Combined with macroeconomic headwinds like slowing growth and looming film tariffs, the downside risk is heavy.
We’re either heading into a recession or bracing for a major news event related to Netflix. The stock is fundamentally overbought and significantly overpriced.
I’ve opened a short position, targeting a 40–60% pullback. In my view, this is one of the best setups to profit from during the current economic slowdown.
As part of my strategy, I’m hedging — holding long positions in undervalued stocks while shorting high-risk names like NASDAQ:NFLX , NASDAQ:PLTR and $TSLA.
⚠️ Not financial advice. This is based solely on my personal research and analysis. Always do your own due diligence before investing.

Netflix (NFLX) Share Price Reaches Record HighNetflix (NFLX) Share Price Reaches Record High
According to the charts, Netflix (NFLX) shares have risen above $1,170 – the highest level in the company’s history. Since the start of 2025, the price of NFLX stock has increased by approximately 33%, while the S&P 500 index (US SPX 500 mini on FXOpen) remains close to its opening levels from 2 January.
Why Is Netflix (NFLX) Performing Strongly?
A month ago, we highlighted several factors contributing to NFLX’s outperformance relative to the broader stock market. Among them is the fact that Netflix does not offer tradable goods subject to tariffs in trade wars. As a result, the company could potentially benefit from an economic downturn if consumers spend more time at home.
According to recent reports:
→ Netflix has announced that 94 million subscribers are now using its low-cost ad-supported plan – a figure more than a third higher than the 70 million reported in November.
→ The company also forecasts that advertising revenue will double this year.
Technical Analysis of the NFLX Share Chart
The share price continues to move within the upward channel (shown in blue) we identified previously. At the same time:
→ the price is currently near the upper boundary of this channel, which has repeatedly acted as resistance (as indicated by arrows);
→ the RSI indicator shows a potential bearish divergence.
Under these conditions, a corrective move in Netflix’s stock price cannot be ruled out – for example, towards line Q or the channel median.
This article represents the opinion of the Companies operating under the FXOpen brand only. It is not to be construed as an offer, solicitation, or recommendation with respect to products and services provided by the Companies operating under the FXOpen brand, nor is it to be considered financial advice.

NETFLIX (NFLX) : Smart Money & AI Convergence Update🕒 Posted: May 13, 2025 | 1H Chart Analysis
Following up on my earlier short bias on NASDAQ:NFLX , we are seeing bearish confirmation aligning with Smart Money Concepts:
🔻 Price tapped the Premium Zone (~$1164) and showed weakness, followed by multiple CHoCHs (Change of Character).
📉 Current structure confirms a breakdown from bullish momentum, and we’re now approaching a key liquidity zone near $1100.
🔍 Targets (SMC-based)
TP1: $1031 – 0.618 Fib Retracement (High probability liquidity zone)
TP2: $951 – Below equilibrium, aligning with strong demand imbalance
🤖 WaverVanir DSS Forecast:
While structure favors a retrace, my WaverVanir DSS AI model is showing a bullish 15–30 day forecast:
15-Day Prediction: $1165.78 (+5.0%)
30-Day Prediction: $1181.09 (+6.4%)
🎯 Strategy:
Short bias remains valid short-term, targeting $1030–$950 as re-entry zones.
If price finds support there with volume + structure shift, I may flip to long positions, aligning with AI model forecast.
💡 Conclusion:
Short-term = Bearish (structure + liquidity sweep)
Mid-term = Bullish (AI forecast + sentiment)
Let’s see if Smart Money drives price into the next liquidity pocket before the next leg up.
📌 #NFLX #SmartMoney #LSTM #VolumeProfile #TradingUpdate #WaverVanir #AITrading #TechnicalAnalysis #SMC

Netflix is going to fall sharply soonNetflix is in the huge 5th wave extension. I expect it to complete wave (v) of 5 very soon, probably within the next week.
RSI divergence on 3-days, weekly frames is quite visible and supports the upcoming trend reversal.
When wave 5 is extended, retracement typically goes to the bottom of wave (ii) of this 5th wave. This would mean 1180-1195 USD to end the wave 5. Also, at this price wave 5 will be 2.168 times bigger than waves 1 and 3 together.

NFLX - overextendedshort at 1150 as a hedge. Good company but P/E of 50 does not make sense vs GOOG or AMZN

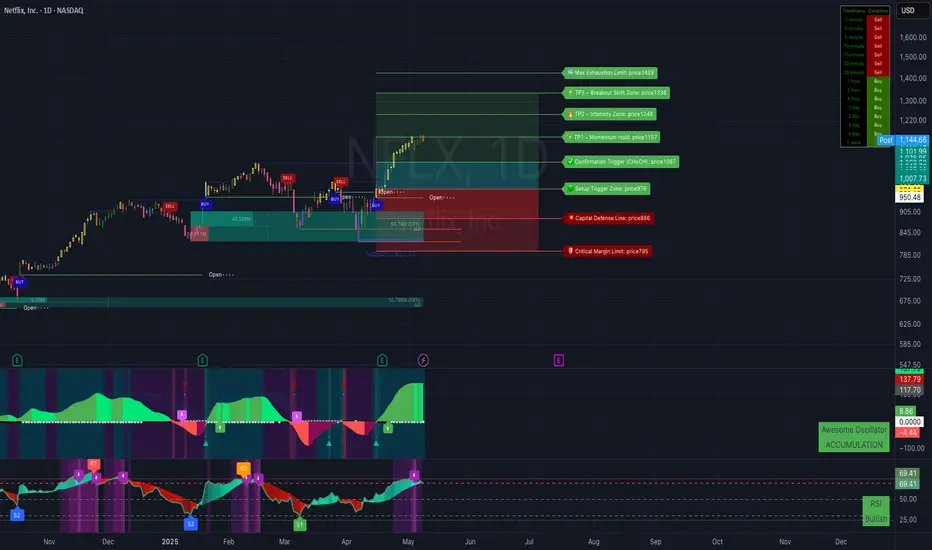
NFLX Multi-Timeframe Outlook – Bullish Exhaustion or Just a Paus 🔍 NFLX Multi-Timeframe Outlook – Bullish Exhaustion or Just a Pause?
🕓 4H Timeframe: Trend Structure May Be Complete
On the 4-hour chart, NFLX shows signs that its recent bullish structure has reached exhaustion.
No fresh breakout has occurred, and momentum is slowing down at the top.
🕒 15-Minute Timeframe: Reversal in Motion
When switching to the 15-minute timeframe, reversal signals are forming, suggesting short-term weakness.
However, this does not confirm a macro trend change yet—it’s more of a pullback setup within a larger trend.
📈 Daily Timeframe: Bullish But Facing Key Resistance
On the daily chart, price has touched the TP3 Resistance Zone around 1157.
At the same time:
AO shows slowing momentum, but buyers are still dominant.
RSI is holding above the midline, suggesting the bull trend is not broken.
This tells us: we're at a high-risk area for reversal, but bulls still control the macro trend.
⚠️ Key Levels to Watch:
📍 Top Resistance: 1157
📍 Key Support / Confirmation Zone: 1067 (from Quantum Confirm ChoCH)
📉 If price drops below 1067, a larger correction may begin.
✅ As long as price holds above, the bullish trend continues.
🔁 Strategy Insight:
If you're trading within the 15-minute chart, you can follow short-term reversals—but:
📌 Avoid bearish trades against the daily uptrend.
📌 Focus on pullback buys, not full bearish swings.
For option traders, if market remains sideways or ranges at the top:
This is a good time to shift to seller strategies (e.g., credit spreads or covered calls).
✅ Summary:
NFLX's 4H trend looks mature, short-term reversal visible on 15m.
Daily still holds strong, but approaching exhaustion.
Strategy: Cautious longs, avoid shorting until a daily break below 1067 confirms structural weakness.
NFLX has been the steady winner in the long runI believe NFLX has a strong growth over the recent years. IMO:
Fundamentals:
1. Net Margin has increased to whopping 27.85% in Q1 '25
2. 70%+ consumers are from high capacity spenders
3. Has nearly always matched the expected revenue in last 5 years
Technical:
1. After the recent high of 1059, there was a downward price, however it has bounced from 830 range
2. The downward trendline is broken at around 951, and also broke the high of 1059 making another higher high
3. Most likely there will be a pullback to 1059 range and again continue to upward trend
Hawkeye on the 1060 range.

$NFLX : Monthly Elliott Wave + Fibonacci RoadmapPublished by Wavervanir_International_LLC | May 7, 2025
Netflix appears to be completing a major Wave (3) cycle at the 1.0 Fib extension level (~$1,159), following textbook Elliott Wave structure with deep retracements and strong impulsive legs.
🔍 Technical Breakdown:
Wave (1) topped near the 0.618 Fib level at ~$770.
Wave (2) retraced deep, bottoming just above $178 (78.6%+ retracement).
Wave (3) extended aggressively, now stalling near Fib confluence zones around 1.0–1.236 levels (~$1,159–$1,244).
⚠️ What’s Next?
A corrective Wave (4) could now be in play, with downside risk toward the $700–$750 zone. This area aligns with the previous Wave (1) top and a 0.382–0.5 retracement of Wave (3), which is typical for Wave (4) pullbacks.
🚀 If this structure holds, Wave (5) targets extend to $1,400–$1,540, matching the 1.618–2.0 Fib extension zones, completing a long-term impulsive cycle.
🧠 Strategic Outlook:
Buy Zone: $700–$750 (Wave 4 opportunity)
Target Zone: $1,400+ (Wave 5 expansion)
Invalidation: Break below $622 or breach of Wave (1) top on weekly close
📊 This is a macro thesis built on momentum, structural symmetry, and Fibonacci precision. Not financial advice—use proper risk management.
#NFLX #ElliottWave #Fibonacci #TechnicalAnalysis #Wavervanir #TradingView #SwingTrading #GrowthStocks #LongTermInvesting

NFLX Head Test Cracking!Head test Cracking! Now we get to see what it's made of.
Head tests patterns take out stops before collapsing.
I was forced into "target reached" by TV. Clearly, my target has not been reached since the H&S never broke to trigger a trade to begin with.
This is a much better setup with very low risk, with potentially huge returns for shorts. A lot of meat on that bone!!
Click boost, follow, subscribe! For more tips, tricks, and calls. Let's get to 5,000 followers and help more people navigate these crazy markets.

NFLX Bearish Setup!This is a simple setup that almost anyone can read—a Head & Shoulders at the top signaling a reversal pattern.
Contrary to popular belief H&S are continuation patterns if they are not at a top.
The only other time H&S are reversal patterns is if the chart has multiple H&S everywhere.
Time for bulls to take their money and RUN!!! The fun ride is over for a while. Time to go home. ((
CAUTION!
Click BOOST, follow subscribe. Let me help you navigate these crazy markets. ))

Netflix (NFLX) Update –May 5th, 2025: Welcome to Uncharted Water📈 Netflix (NFLX) Update – May 5th, 2025: Welcome to Uncharted Waters
On April 9th, I posted a chart showing potential signs of a reversal for NFLX. Price had formed two indecision candles — classic behavior near turning points — and I was eyeing a potential correction. My original thesis pointed to a retest zone between $344–$443, or a drop toward a new low.
Fast forward to today, May 5th, and price has done the complete opposite — broke through the previous high at $1,064.50 and printed a new high at $1,134.06+. At this point, it’s safe to say:
👉 Netflix is officially in uncharted territory.
I’m beyond impressed with the strength of this move. While I was prepared for a pullback, I also know from experience — you can never time the market perfectly. That’s something I constantly try to emphasize when people ask:
“How long will it take to drop?” or “When is the next entry?”
Truth is, we can only measure candle closures and expiration timeframes. Outside of that, it’s all about reacting to structure, not predicting with emotion.
So where do I stand now?
🚫 No FOMO.
👀 Watching closely.
📉 Waiting for a deeper pullback or confirmed structure to re-enter.
💡 And reminding folks: Sometimes the best position is patience.

Break and retest setup on NFLX soon? OptionsMastery:
🔉Sound on!🔉
📣Make sure to watch fullscreen!📣
Thank you as always for watching my videos. I hope that you learned something very educational! Please feel free to like, share, and comment on this post. Remember only risk what you are willing to lose. Trading is very risky but it can change your life!

NFLX: Bearish Reversal Setup - Macro Pressure & Volume Gap Risk🕒 15 min & Daily Charts | 📅 May 5, 2025
Ticker: NASDAQ:NFLX
Netflix (NFLX) is flashing warning signs after a steep rally from the April lows. Price action has now rejected the $1,150–$1,155 zone, confirming a local top with divergence and bearish engulfing on the daily. On the 15-minute chart, we see clear Fibonacci levels being respected with a break below 0.382 followed by a rejection of the 0.236 zone.
🧠 Confluence of Bearish Factors:
Macro Headwind: Trump's proposed 100% tariff on foreign film production hits Netflix's cost model hard. This geopolitical risk could reduce margins (source: The Guardian, May 2025).
Volume Profile Analysis: Price is above a thin volume node with little support until the $1,000–$1,030 zone, increasing vulnerability to sharp drops.
Fibonacci Targets: Measured move from $1,151.68 → $1,107.08 gives downside Fibonacci extensions to:
🔻 1.236 – $1,094.76
🔻 1.382 – $1,087.13
🔻 1.786 – $1,066.04
🔻 2.0 – $1,054.85
Daily Rejection Candle: Today's -1.74% bearish candle completes a rising wedge breakdown.
🎯 30-Day Probabilistic Outlook:
🟢 Bull Case: $1,290 (20% probability, if tariffs fail or are watered down)
🟡 Base Case: $1,066.58 (50% probability – Fib target + volume support)
🔴 Bear Case: $979.59 or lower (30% probability – volume gap fill and macro fear)
💡 Playbook:
Intraday scalpers can short retests of $1,143–$1,146 (golden pocket).
Swing traders can target $1,066 and trail with 3-bar structure.
Add-on confirmation with VIX > 18 and Fed staying hawkish on May 7th.
📌 Not financial advice. For institutional and strategic educational use under the Wavervanir DSS framework.
#NFLX #ShortSetup #Fibonacci #MacroTrading #VolumeProfile #BearishReversal #WavervanirDSS #TradingView #AITrading

Netflix price correction will continueBased on the 2-month Cash Data chart, it is quite clear that the diametric pattern is completing.
Considering that the diametric wave-(B) has taken a lot of complexity and time, it seems that the wave-(F) is not completed and has little complexity and time, so we considered two scenarios for the wave-(F):
Scenario 1
Considering that after the wave-(E) there was a rapid downward movement, the wave-(F) will become an irregular contracting triangle, then the wave-(G) will start and grow
Scenario 2
The wave-(F) can turn into a flat pattern with a strong wave-b. In this type of flat, usually the wave-c cannot retrace the entire wave-b, as a result, the wave-c of this type of flat pattern can turn into a terminal pattern, and then the diametric wave-(G) of a higher degree will start.

Netflix Skyrockets After Q1 Revenue Surge: What’s Next?📺 NASDAQ:NFLX has recently exhibited a strong bullish trend, supported by both technical breakout structure and positive fundamental developments. After an extended rally from the March lows, the stock managed to break above a key resistance zone between $1,080 and $1,100, it has now been decisively cleared. With this breakout, the structure confirms bullish momentum, and the expectation is for a retest of this newly formed support area before resuming the uptrend.
The price is currently around $1,133, and a pullback into the $1,060–$1,080 zone would present a high-probability buy opportunity. This aligns with classic price action behavior: after a breakout, markets often retrace to test former resistance, now turned support. If we see it retest, it would validate the technical setup for a continuation move toward the projected target of $1,220.
🌟From a fundamental perspective, the recent Q1 earnings report (released on April 17, 2025) added strong fuel to the upside momentum. Netflix reported $10.54 billion in revenue for the quarter, exceeding Wall Street’s expectations and representing a 13% year-over-year growth. Net income also impressed, coming in at $2.9 billion. Perhaps more telling than the earnings themselves was Netflix’s decision to stop reporting quarterly subscriber numbers. This shift in focus toward profitability and revenue per user signals confidence in their monetization model and emphasizes a transition to a more mature phase of growth. Management’s tone on the earnings call adds to all this, citing growing traction in its ad-supported tier and plans to expand into live sports and podcast-style content.
💰Technically, the overall structure remains bullish. The breakout is clean, and volume is supportive. The area above $1,140 has low volume resistance, which means price can move relatively easily toward the next psychological barrier at $1,220. Any deeper pullback that breaches below $1,020 would invalidate the short-term bullish bias, as it would signal a failure to hold above former resistance and could mean the start of a deeper correction toward the trendline support from last October.
🚀 In conclusion, the current market behavior suggests Netflix is in the process of forming a bullish continuation, supported by a clean breakout above prior resistance, robust financial performance, and an optimistic revenue outlook.
Price is likely to retest the breakout zone, offering a potential long setup anticipating a move higher if momentum remains strong. The technical picture is backed by future growth plans, making Netflix a stock to watch closely in the coming weeks for confirmation of the pullback and continuation.

NFLX Institutional Momentum Anchored in Multi-Decade ChannelNetflix (NFLX) has maintained a structurally intact long-term bullish momentum, consistently trading within a well-defined ascending channel dating back to the early 2000s. Price action has respected dynamic support and resistance levels within the channel, establishing a sequence of higher highs and higher lows that validate the primary uptrend.
Following a breakout from a major resistance zone around 2023, the stock exhibited accelerated bullish momentum, aligning with internal demand structures and confirming institutional accumulation. Price is currently advancing toward the upper boundary of the long-term channel, with the projected target around 4,935, coinciding with channel confluence and historical extension levels.
As long as the price action maintains structural integrity above the key anchored support near 1,154, the prevailing trend remains decisively bullish. A clean break and close above the upper bound of the channel may trigger an extended rally, while any rejection at this level would likely result in a cyclical mean reversion toward mid-channel equilibrium.

Nflx.. It's almost timeAscending broadening wedge pattern showing here..
Monthly RSI is over 80 which means NFLX stands a higher chance of tagging 700 before 1300..
Daily RSI and Money Flow is absurd
Weekly candle is outside Bollingerband
It's just red flag after red flag for this stock
I don't think this clears 1150 and I think the next stop is 900 before a dead cat bounce
Monthly chart
Bulls see a break out above yellow trendline but I see a fake out..
Price is extended way above monthly bbands and like I said before, the monthly RSI is approaching 90, that is not a combination for a sustainable breakout...
I think a 50% discount is coming for this stock in the next year

Netflix (NFLX) Hits New Highs Post-Tariff WarNetflix (NFLX) has surged to a new all-time high, overcoming market jitters sparked by President Trump’s tariff announcements. The stock hit a low of $821.10 on April 7, 2025, during tariff-related volatility but has since rallied in a five-wave impulse pattern, as outlined by Elliott Wave theory—a method used to forecast price trends.
From the April 7 low, Wave (1) peaked at $922.42, followed by a pullback in Wave (2) to $848.53. Netflix then entered Wave (3), which is still unfolding. Within Wave (3), the first sub-wave, Wave 1, reached $951.43, and a corrective Wave 2 ended at $894. Wave 3 of (3) is now in progress, showing a smaller impulsive structure. Within this Wave 3, the first smaller sub-wave, Wave ((i)), hit $992.94, and the pullback in Wave ((ii)) concluded at $949.16.
Wave ((iii)) of 3 is nearing completion, after which a brief dip in Wave ((iv)) should occur. Afterwards, Netflix should rise again in Wave ((v)) to finish Wave 3 of (3). As long as the $848.53 support holds, pullbacks should attract buyers in 3, 7, or 11 swings, paving the way for further upside. Expect additional highs as the bullish trend continues.

Netflix Wave Analysis – 29 April 2025
- Netflix broke key resistance level 1063.40
- Likely to rise to resistance level 1150.00
Netflix recently broke the key resistance level 1063.40 (former multi-month high from February, which stopped the B-wave of the previous ABC correction (B)).
The price just broke the resistance trendline of the weekly up channel from October – which should accelerate the active impulse waves 3 and (5).
Given the clear daily uptrend, Netflix can be expected to rise toward the next resistance level 1150.00, target price for the completion of the active impulse wave 3.
