NVIDIA’s crushing it as the undisputed king of AI chipsNVIDIA’s crushing it as the undisputed king of AI chips, owning a jaw-dropping 70-95% market share. Their GPUs are the beating heart of data centers worldwide, powering the AI revolution with unstoppable momentum. Last four quarters? A cool $80B in revenue—growth that’s pure rocket fuel. Net margins at +56% scream profitability, while a forward P/E of 23.3 (cheaper than Starbucks!) makes it a steal for this kind of dominance. EPS projected to soar +29% annually over the next five years? That’s long-term winning vibes.
Their Blackwell Ultra chip, set to drop at GTC today, is about to flex even more muscle, and the Vera Rubin superchip’s got tech heads buzzing. Zero debt worries, industry-leading margins, and a massive addressable market—NVIDIA’s fundamentals are a fortress. Sure, trade war noise and a 10% YTD dip spook some, but this oversold gem (RSI 34) is primed to rally hard. Jensen Huang’s a visionary steering this beast, and with AI demand exploding, NVDA’s not just hot—it’s molten. Time to ride this wave, Freund!
NVDA trade ideas

I HAVE A NEW STRATEGY! Watch it work for me. SAYS BUY🚨 Exclusive Trading Opportunity – Limited Time Only! 🚨
I've developed an amazing new trading strategy that’s completely unique and never seen before! It’s called the Skyline Scalping Strategy, and it’s designed to pinpoint market direction with extreme accuracy—something that can easily be back-tested by reviewing my previous predictions.
For a limited time, I’ll be posting daily trade signals based on this strategy, allowing you to see exactly where I anticipate the market will move next. Whether you're an amateur trader or a seasoned professional, this is your chance to witness something game-changing in action.
⚠️ Disclaimer: I’m not providing financial advice—just sharing the direction I am planning to make money. The Skyline Scalping Strategy works exclusively on the daily chart, so stay tuned and watch as the predictions unfold!
FOLLOW NOW and don’t miss out on these powerful insights! 📊🔥
Vertical lines are colored and placed to indicate the expected direction of the price. Just my thoughts.

Nvidia moment of truthfull retest of the broken trendline, confirming it as resistance will lead to filling the gap around 70$

$NVDA down Nvidia's inaugural Quantum Day, scheduled for March 20 during its GTC 2025 conference, underscores the company's commitment to advancing quantum computing. This event brings together industry leaders to discuss current capabilities and future potential, highlighting Nvidia's recognition of quantum technology's growing significance.
Impact on Technology Stocks:
The announcement of Quantum Day has already influenced the stock market. Quantum computing companies like D-Wave Quantum, Rigetti Computing, and IonQ have experienced notable stock price increases, reflecting investor optimism about upcoming developments and collaborations that may be unveiled during the event.
Implications for Quantum Computing and AI:
By dedicating a day to quantum computing, Nvidia signals its intent to integrate quantum advancements with artificial intelligence (AI). This integration could lead to significant breakthroughs in processing capabilities, enabling more complex AI models and applications. The focus on quantum computing at GTC 2025 suggests that Nvidia aims to position itself at the forefront of this convergence, potentially accelerating the commercialization of quantum technologies in AI.
In summary, Nvidia's Quantum Day signifies a strategic move to embrace and promote quantum computing, with anticipated positive effects on technology stocks and the future landscape of AI and computational technologies.

Consider a Long Position: Nvidia Poised for AI-Driven Growth- Key Insights: Nvidia remains a robust choice for investors seeking exposure to
AI technology innovation. The stock recently advanced by over 5%, indicative
of strong positive momentum in the semiconductor sector. Nvidia's strategic
positioning in AI and computing technologies, along with the backing of
seasoned investors, bodes well for its future trajectory. The GTC conference
may serve as a pivotal catalyst for further appreciation in Nvidia’s market
value.
- Price Targets: For the upcoming week, consider the following levels for a long
position. Target 1 (T1) is set at $127, and Target 2 (T2) is at $135. Stop
Level 1 (S1) is $116, and Stop Level 2 (S2) is conservatively placed at
$112. These targets account for Nvidia's recent performance, market
momentum, and anticipated technical challenges.
- Recent Performance: Nvidia has demonstrated remarkable resilience, aiding in
the semiconductor sector's recovery with a noteworthy rise in its stock,
particularly over the past week. This performance underscores its pivotal
role in the AI chip market and its capacity to drive growth during broader
market rebounds.
- Expert Analysis: Analysts continue to express a bullish stance on Nvidia,
emphasizing its technological leadership and potential for long-term growth.
Despite recent market corrections, the general sentiment reflects confidence
in Nvidia's trajectory. Industry voices like Brad Gersner view current
valuations as an appealing entry point for heightened future returns, driven
by the company’s advancements in AI and ecosystem integration.
- News Impact: Nvidia's participation in upcoming key events like the GTC
conference has the potential to bolster market sentiment significantly.
Announcements on next-generation AI developments and products could catalyze
further stock appreciation. Additionally, Nvidia’s recognition in AI circles
and strategic innovations solidify its competitive edge amidst global
technological challenges and geopolitical factors. The entry of new
competitors like Deep Seek, however, adds an element of market complexity
that investors should watch closely.

NVDA Heating Up! Is a Breakout Incoming? Mar 17 weekChecking NVDA on the 4-hour chart for some actionable trade setups.
📈 Technical Analysis (TA):
* NVDA clearly broke through its descending wedge, hinting at a bullish reversal.
* Noticed a Change of Character (CHoCh) which signals the momentum shifting upwards.
* Current resistance (supply zone) around $122–$126 is the key level to watch.
* Major support at the recent BOS around $104.35; keep an eye here if price retraces.
* Upper supply zone around $143 could act as a strong resistance if the breakout continues.
📊 GEX & Options Insights:
* Highest positive NET GEX and call resistance at $126—crucial gamma wall here.
* Strongest PUT support around $110, marking the lower boundary clearly.
* IV Rank at 36.1% suggests moderate premium pricing—consider credit spreads or debit spreads strategically.
* CALL ratio at 28.4% indicating slightly bearish options sentiment.
💡 Trade Recommendations:
* Bullish Play: Wait for NVDA to confidently close above $126; aim calls towards the $140 range. Keep stops tight around $120.
* Bearish Play: Look for rejection at $126. Consider puts targeting the $110–$104 zone.
* Neutral traders can implement Iron Condors or spreads between clear ranges ($110–$126).
🛑 Risk Management: Stick to disciplined trades, and manage your risk carefully given moderate volatility.
Happy trading, team!
Disclaimer: This analysis is for educational purposes only and does not constitute financial advice. Always do your own research and manage your risk before trading.

Nvidia (NVDA) Bullish Opportunity – GTC 2025 & AI GrowthCurrent Price: $121.67
✅ TP1: $130 – (short-term resistance, +7%)
✅ TP2: $145 – (medium-term breakout target, +19%)
✅ TP3: $175 – (analyst target, +43%)
🔥 Why Bullish?
1️⃣ GTC 2025 Conference (March 17-21)
CEO Jensen Huang’s Keynote (March 18) is expected to unveil:
Blackwell Ultra (B300 series): Next-gen AI GPU with 288GB memory.
Rubin GPU Preview: NVIDIA’s roadmap beyond 2026.
Quantum Day (March 20): NVIDIA’s first quantum event, showcasing its role in quantum simulation despite earlier skepticism—potentially broadening its tech leadership.
Market Sentiment: High anticipation for AI & chip updates, with some seeing 30%-50% upside if AI demand is reaffirmed (e.g., new contracts, backlog growth).
2️⃣ Analyst Ratings & Price Targets
Strong Buy Consensus from analysts.
Average 12-Month Price Target: $174.79 → +43.59% upside.
Price Target Range: $120 (low) to $220 (high).
3️⃣ Technical Setup – Breakout Potential
Falling Channel Formation – Price is bouncing from strong support (~$115).
MACD Bullish Crossover – Momentum is shifting in favor of buyers.
Breakout Level: Above $130 would trigger stronger upside.

NVDIANVDIA is close to completing bigger correction, soon enough we will head to break the top minimum.
Disclosure: We are part of Trade Nation's Influencer program and receive a monthly fee for using their TradingView charts in our analysis.

Another Leg down for NVDAHello Traders,
If we do not see NVDA rise about the $121-$124 level for a large amount of volume... we should see another leg down from this area... I am expecting NVDA to drop below $100 in the next 2 weeks. I personally believe by April this stock will see its bottom around $75. It may happen faster. Good luck.

NVDA - what to expecthi traders,
In this analysis we will have a look at NVDA on 1D time frame.
As we can see, the price found support at 105$ and we got a rejection to the upside.
However, we should be realistic with our expectations.
2 scenarios that I expect to play out:
1. The price gets rejected at the downsloping resistance line and the price will revisit the area of 110-105$ which will be an entry zone for longs.
Stop loss should be placed below 105$.
2. If the price closes below 105$, it should go to the buy zone 2 presented on the chart.
In both scenarios, I expect a new all-time high for NVDA.
Buying at buy zone 2 would be a great entry for a swing traders and long-term investors.

$140 - $150 are imminent for NVDANVIDIA Stock Analysis & Forecast
Price Outlook: $140 - $150 in Sight
NVIDIA (NVDA) has consistently been one of the most rewarding stocks for investors, delivering substantial returns over the past few years. However, following its all-time high (ATH) of approximately $153 on January 7, 2025, the stock experienced a notable pullback, declining to around $105.
Since that dip, NVDA has shown signs of recovery, with the current price stabilizing at $121.67. This upward momentum suggests a potential rally toward the $140 - $150 range in the near term.
Investment Strategy
Long-Term Perspective: Given NVIDIA’s strong fundamentals and market dominance, accumulating shares for long-term investment remains a solid strategy.
Short-Term Trading: For traders, technical indicators suggest potential entry and exit points. Refer to my chart for the accompanying chart for detailed technical analysis (TA) insights.
While the stock has shown resilience, monitoring key support and resistance levels will be crucial in determining the next phase of its movement.

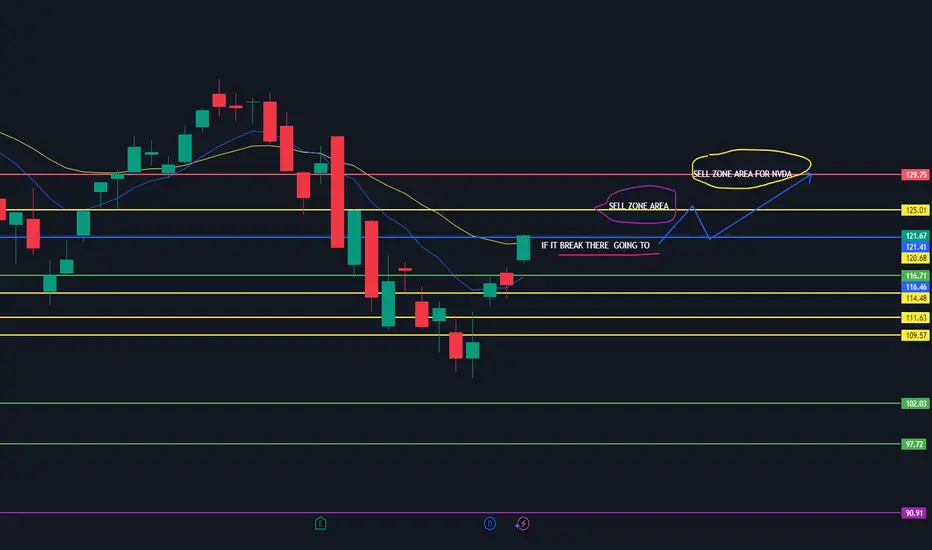
NVDA ZONNVDA has a chance to break these highlight level and moving back down again!.....
"Probability in our Technical Analysis"
Nvidia Rises Over 4.5% and Reclaims $120 ZoneBy the end of the week, Nvidia's stock has surged to $120 , with the strong bullish movement likely driven by positive results from its largest supplier. Taiwanese company Hon Hai Precision Industry (Foxconn) reported revenues exceeding $30 billion and announced plans to establish the world's largest chip manufacturing plant in Mexico, aimed at improving supply efficiency for its main client, Nvidia. This news has restored investor confidence in the short term, and if this positive momentum persists, the bullish pressure surrounding the stock could intensify further.
Large Bearish Channel:
Despite the recent confidence in Nvidia, it is important to note that since early January, the stock has been forming a large bearish channel, and its current price remains midway within that channel. This suggests that the short-term buying momentum still has room to grow, but it has not yet been strong enough to break the dominant bearish formation.
RSI Indicator:
The RSI indicator has started showing an upward slope, and the RSI line is preparing to cross the neutral 50 level. This could indicate that buying momentum may begin to take control, especially if the RSI line continues to move consistently above this neutral level in the upcoming sessions.
MACD Indicator:
The MACD histogram is showing a similar pattern, as it is currently testing the neutral 0 line. If a crossover occurs, it would suggest that the moving average trends are turning bullish, potentially reinforcing buying confidence in the following sessions.
Key Levels:
$130 – Significant Resistance: This level coincides with the bearish trendline and the 38.2% Fibonacci retracement level. A breakout above this level could challenge the current bearish channel and pave the way for stronger buying momentum.
$115 – Near-term Support: This level aligns with the 61.8% Fibonacci retracement barrier. If bearish oscillations push the price below this level, it could completely negate the current buying sentiment and extend the long-term bearish trend that has persisted for weeks.
By Julian Pineda, CFA – Market Analyst

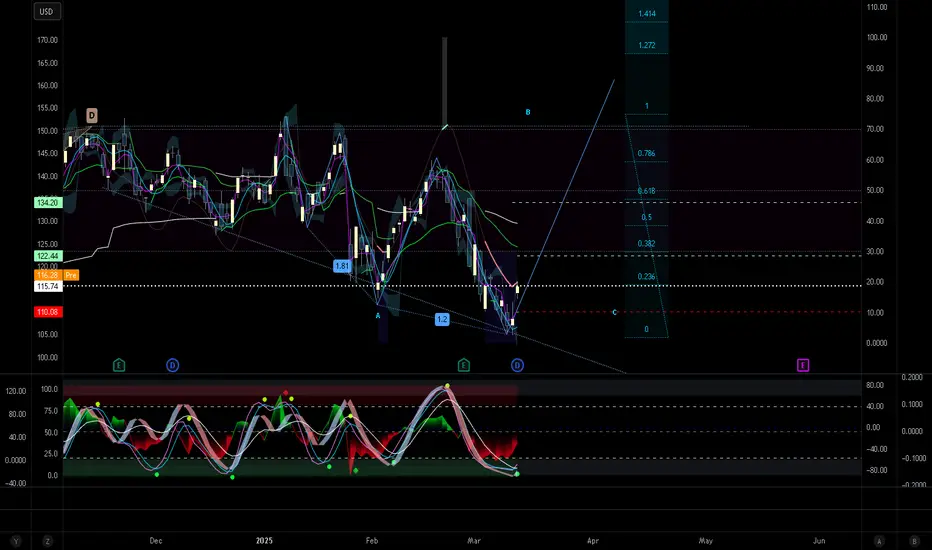
NVDA - Forming a local bottom? Looking at potential local bottom being formed, new to this but this is my thesis.
To me it looks like the 6th wave is starting to complete, then it going to roll over to form the 7th wave before I would consider it being the bottom. It might pass or meet its recent low(bottom of 6th wave 106-102 range). If it holds there, then I would watch for an accumulation to form. Before it tries to go back up and retest the ATH.
Let me know what you think. Time will educate us on what its going to do.

NVDA Bearish Channel Structure TradeNVDA has been respecting this bearish channel since Nov '24 with 5 touches on the lower trendline and 4 touches on the upper.
NVDA most recently bounced off the lower support, making the 5th touch, and gapped up with the indicies to reclaim the midpoint of the channel. With the midline acting as support, movement towards the upside of $127-$130 is much more likely.
Significant resistance might be met at the $125-$126 level but past that the runway is relatively clear for full retracement of the structure.
Structure trade can be easily invalidated by broader macro factors, tariff revisions, & tweets.

$NVDA double-bottom bull flag long...This is the daily of NVDA with a 150 EMA. In my opinion, we are seeing the formation of a double-bottom bull flag. Since most trends continue, I view this as a high-probability to enter or add to a long position on NVDA. With GTC happening next week as a potential bullish catalyst, this adds to my long conviction. Great trading, everyone.
-MrJosephTrades

NVDA Short Term BuyPrice is currently consolidating within a tight range, and a breakout appears imminent. I am looking for a clean break above resistance, followed by a retest of the breakout level, which could provide a strong buy opportunity. If this setup plays out, the next key target would be the $135 level.
However, this move is likely to be a short-term retracement within a larger downtrend. If price struggles to sustain momentum above $135 and shows signs of weakness, it could indicate a continuation of the broader bearish trend. Confirmation will come from price action signals and volume dynamics on the retest.

Nvidia Just Under Major SupportNvidia seems to have been pulled down by the Dow just like Apple as both are just under major support. I'm sorry for my previous Nvidia chart that drew support near 140, I recognize where I screwed up, but this chart should be good. Fortunately actual 117 support wasn't that far below and my NVDA isn't too in the red.
NVDA has the lowest revenue multiple in years right now. I know it's well off it's long term trend line, but it's growth rate is unlike anything it's ever been so expecting a steeper trend line to appear makes a lot of sense. Eventually I would imagine we'll get back to that trend line, but not anytime soon.
The Dow hitting major support should finally lift NVDA and the others that have been dragged down like AAPL and AMZN.
Good luck!

Take Two on Nvidia Pivot Play. NVDAThe setup stopped out last time with acceptable losses. It is time to try the markets, probability and harmonics once again. This time the indicators below are in alignment also
Nvidia (NVDA) Share Price Rises Over 6%Nvidia (NVDA) Share Price Rises Over 6%
The NVDA stock chart shows that following yesterday’s trading session, the share price climbed over 6%, outperforming the Nasdaq 100 index (US Tech 100 mini on FXOpen), which gained just over 1%.
Despite this recovery from a six-month low, NVDA shares remain down 15% year-to-date.
Why Did Nvidia (NVDA) Shares Rise Yesterday?
Positive sentiment swept through the stock market after U.S. inflation data came in lower than expected. The Consumer Price Index (CPI) for the month stood at 0.2%, below analyst forecasts of 0.3% and the previous reading of 0.4%.
Investors may now be looking for opportunities following the March sell-off, triggered by Trump’s tariff policies and recession fears—and NVDA shares appear attractive in this context.
Barron’s suggests that NVDA stock may currently be undervalued, while MarketWatch cites BofA analyst Vivek Arya, who advises investors to focus on Nvidia’s gross profit margins as a key driver of significant share price growth.
Technical Analysis of NVDA Stock
Earlier this month, we identified a descending channel (marked in red) and suggested that its lower boundary could act as support—which was confirmed (highlighted by the circle).
Bullish perspective:
- The stock opened with a bullish gap and gained throughout the session, failing to hold below the psychological $110 level.
Bearish perspective:
- The price remains within the descending channel, with the median line potentially acting as resistance.
- The $117.50 level, previously a support, has turned into resistance (as indicated by the arrows) and may pose a challenge to further recovery.
NVDA Share Price Forecast
According to TipRanks:
- 39 out of 42 analysts recommend buying NVDA stock.
- The average 12-month price target for NVDA shares is $177.
This article represents the opinion of the Companies operating under the FXOpen brand only. It is not to be construed as an offer, solicitation, or recommendation with respect to products and services provided by the Companies operating under the FXOpen brand, nor is it to be considered financial advice.

NVDA - Bearish IdeaA Three downward move situation with the last dip being the largest pushing price down to a lower trend line in red (dotted line)
Bars pattern tool in red shows my thoughts of the bearish movement
I think price will continue down below the green line that has previously been seen as support
Daily chart

NVIDIA Stock Chart Fibonacci Analysis 031225Trading Idea
1) Find a FIBO slingshot
2) Check FIBO 61.80% level
3) Entry Point > 108/61.80%
Chart time frame: B
A) 15 min(1W-3M)
B) 1 hr(3M-6M)
C) 4 hr(6M-1year)
D) 1 day(1-3years)
Stock progress: A
A) Keep rising over 61.80% resistance
B) 61.80% resistance
C) 61.80% support
D) Hit the bottom
E) Hit the top
Stocks rise as they rise from support and fall from resistance. Our goal is to find a low support point and enter. It can be referred to as buying at the pullback point. The pullback point can be found with a Fibonacci extension of 61.80%. This is a step to find entry level. 1) Find a triangle (Fibonacci Speed Fan Line) that connects the high (resistance) and low (support) points of the stock in progress, where it is continuously expressed as a Slingshot, 2) and create a Fibonacci extension level for the first rising wave from the start point of slingshot pattern.
When the current price goes over 61.80% level , that can be a good entry point, especially if the SMA 100 and 200 curves are gathered together at 61.80%, it is a very good entry point.
As a great help, tradingview provides these Fibonacci speed fan lines and extension levels with ease. So if you use the Fibonacci fan line, the extension level, and the SMA 100/200 curve well, you can find an entry point for the stock market. At least you have to enter at this low point to avoid trading failure, and if you are skilled at entering this low point, with fibonacci6180 technique, your reading skill to chart will be greatly improved.
If you want to do day trading, please set the time frame to 5 minutes or 15 minutes, and you will see many of the low point of rising stocks.
If want to prefer long term range trading, you can set the time frame to 1 hr or 1 day.

NVDA See you at $95With my previous prediction still on its strong 2 feet.
NVDA moved up 6% while some think a blessing will come down from Olympus I will sit to collect their fate on the $95 area the correct support from the $90 consolidation area.
