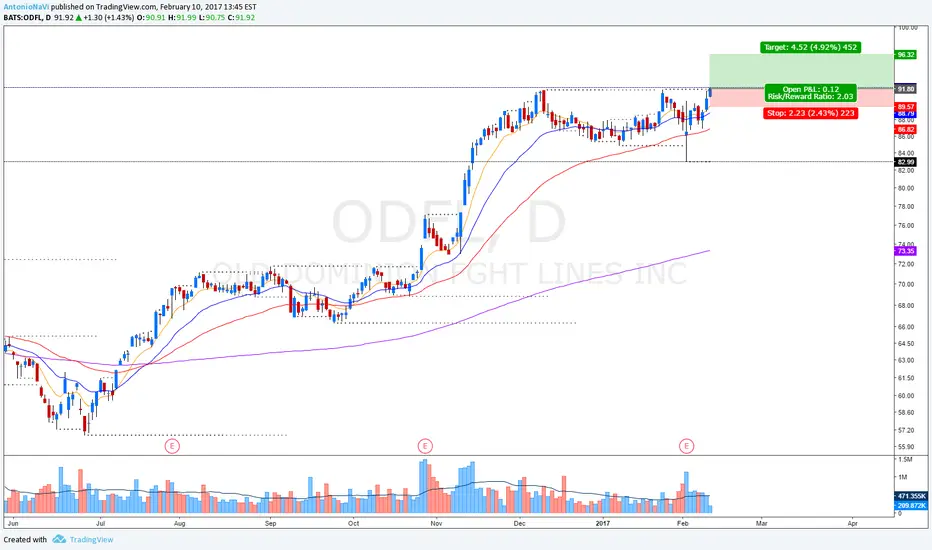
Old Dominion finds Bullish Trend in EMAI think we might be able to observe a nice runup in this freight co.
ODFL trade ideas

ODFL - Elliottwave analysis - ABC correction downODFL - It has completed impulse up cycle in 4 hr time frame from major low. The sharp drop looks more like a wave A and expected to correct in B wave in choppy fashion. Sell it near 206-210 with stop level above 213.15 for target zone near 190 or even lower level. If it crosses above new high, then it starts extending 5th wave and can go much higher thereafter.
Give thumbs up if you really like the trade idea.

ODFL Cup with Handle FormationNASDAQ:ODFL
ODFL has seen increased sponsorship and built a setup that was set until today's price action across the market struck.
Current buy is at 205.11. Consider selling if dropping further to $195

Cup and Handle Patterns above Patterns A Triangle 10/27 BMOEarnings 10-27 BMO and they do miss
But Zack says it is a buy..lol...Zack is not always right so do your research
Not to long entry level/this pattern is only valid at or over entry level
NV is high on this one as is OBV
ODFL fell from a Risng wedge but seems to have recovered
Transport having a bit of a pull back as of late
Go with your gut on this one if you trade it before earnings
Not a recommendation
If you wants Zack's opinion, just type in the stock
www.zacks.com

$ODFL - one of my favorite optionsDividends produce dips, folks hold til they get their 40 cents and then dump.
Watch for next entry point to make my standard 45% return on this bad boy. I love it.

OLD DOMINION FREIGHT LINE daily analyses Hi friends
the daily chart shows that it will experience an uptrend in the next few days with a very high probability but at the same time it is better to be vigilant of the change from the direction to the opposite
please subscribe to receive more analyzes

Old Dominion Freight Lines should have a $190 price targetOld Dominion is a jewel of a company, and is very well run. I feel confident targeting $190/share if we get a nice bullish confirmation candle.
21.47B Market Cap
Income 615.4M
Sales 4.11B
Div% 0.33%
P/E 35.19
Forward P/E 31.24
P/FCF 46.5
Quick Ratio 1.90
EPS this Y 3.7%
EPS Next Y 21.97%
Sales Q/Q -0.3%
EPS Q/Q 1.5%
ROA +15.8%
ROI +19.5%
Profit Margin +15%
Short Float 2.47%

Standard Trade - Very safe - Support turned into ResistanceA few standard reasons to take this trade. It is near an ATH which is something that I don't prefer. Various other reasons for taking this trade on ODFL that i didn't mention.

Freight Line to the Top!What I see...
+ 10ma support
+ prices pulled back from last week's high
+ bullihs MACD
+ RSI is side way
+ Consecutive NR7 on descending volume
- Upper shadows in the past few days
- Both RSI and MACD look to be turning bearish
- Higher price stock
What I setup...
+ Long entry above -1d high
- Stop is today's low
+ Target is at $177
:: Duration - 4 to 10 sessions
** Comments and Likes are appreciated; New Subscribvers are Beautiful! **


Old Dominion Freight - Long entry setupWhat I see...
+ Prices bounced back from mid-March low of $110 forming a v-shape pattern
+ Along the way, prices zig zac along major Fib marks
+ Huge vol. back in Dec!
+ Prices moved side way in the past few sessions
+ MACD has crossed upward
+ Both 10 and 50 MA are above 200MA
+ RSI at 62
+ 52 week & all-time high
- prices are distance from 10MA
- prices could continue to go side way, within channel, until 10 MA has pulled closer
- Slight upper shadows across the past few sessions
What I setup...
Long entry if break above last week's high
Target at 0.618 Fib
Stop at -4d low

Proposed Short of $ODFL Finished on LowsFinished on lows of the day. I propose the idea of going short this overbought trucking stock. All ideas are opinions only and should not be considered trading advice.
ODFL

Short Idea: Industrials Appear To Have ToppedFor the short-term I believe the industrials are in for a correction. Pick areas where it's re-testing previous day's high. Of course, this is just my opinion. Do your own due diligence. This is not trading advice.
My ideas are:
ODFL
JBHT
IYJ

$ODFL Looking ExtendedVery extended beyond its 50 day avg at $168 RSI showing overbought...especially on a miss on eps and revenue today... I’ve opened a put position. Do your own due diligence. Goodluck.


Great Chance to buy long term outperformer? With Transports going out to all time highs ODFL ran across my screen
Todays close presents us with a great risk reward oppurtunity.
Thesis is for monthly timeframe to catch 70 RSI level support here and remain in an out right bullish trend.

ODFL Detected possible stock repurchase!!!ODFL: old dominion freig
2018-05-17 16:47:14
Detected possible stock repurchase

Bearish on ODFLLooks like it's forming multiple tops, I think it may go down from here. Do your own DD.


ODFL approaching $80ODFL is a good trending stock, but volume is fairly thin. This can affect liquidly when entering and exiting trades.
The weekly uptrend has been long and linear - the pullbacks have become a little deeper but are more than acceptable on this timeframe.
On the daily chart, however, the pullbacks have caused a bit more of a concern. During early 2014 there were better charts to trade. Since the October 2014 pullback the trend does seem to have settled down. If you're comfortable with fairly large stops and low volume this could well be a long-term buy opportunity.

