ORCL trade ideas

$ORCL Analysis, Key levels & targets $ORCL Analysis, Key levels & targets
Alright… Here’s the ORCL battle plan --- looking to start a position at 79.17
And then all of the targets below are add levels…
I’m really looking forward to this one 😏
——————
I am not your financial advisor, but I will happily answer questions and analyze to the best of my ability but ultimately the risk is on you. Check out my ideas, but also do your own due diligence.
I am not a bull. I am not a bear. I just see what I see in the charts and I don’t pay too much attention to the noise in the news.
If you want me to analyze any stock or ETF just leave me a comment and I’ll do it if I can. (If I have time)
Have fun, y’all!!
(\_/)
( •_•)
/ >🚀

ORCL making a run to 92.5? X marks the spot. Of the best looking megatech names out there. note the big dink was after earnings where there was a large acquisition announcement etc.


Oracle USASun Storm Investment Trading Desk & NexGen Wealth Management Service Present's: SSITD & NexGen Portfolio of the Week Series
Focus: Worldwide
By Sun Storm Investment Research & NexGen Wealth Management Service
A Profit & Solutions Strategy & Research
Trading | Investment | Stocks | ETF | Mutual Funds | Crypto | Bonds | Options | Dividend | Futures |
USA | Canada | UK | Germany | France | Italy | Rest of Europe | Mexico | India
Disclaimer: Sun Storm Investment and NexGen are not registered financial advisors, so please do your own research before trading & investing anything. This is information is for only research purposes not for actual trading & investing decision.
#debadipb #profitsolutions

Buy oracle (ORCL) 5/1/2022You can buy ORCL target 99.8 stop loss 84.35
Money management your responsibility.
I recommend entering a maximum of 10% of the portfolio.
Good luck

$ORCL Deep oversold bounce back into historical channelNice hammer doji on the daily signaling a possible reversal. Bouncing nicely off historical support. Looking for a move back to the supply zone for a nice ~4% move. Time horizon ~2weeks.

ORCLOversold and bounced off a weekly support with very strong bullish sentiment. Expected a move to the upside.

Oracle 2nd wind? Found some trendline support today and bounced off its 200sma.
Oracle closing with a bullish hammer candle here.
Money flow is over sold on the
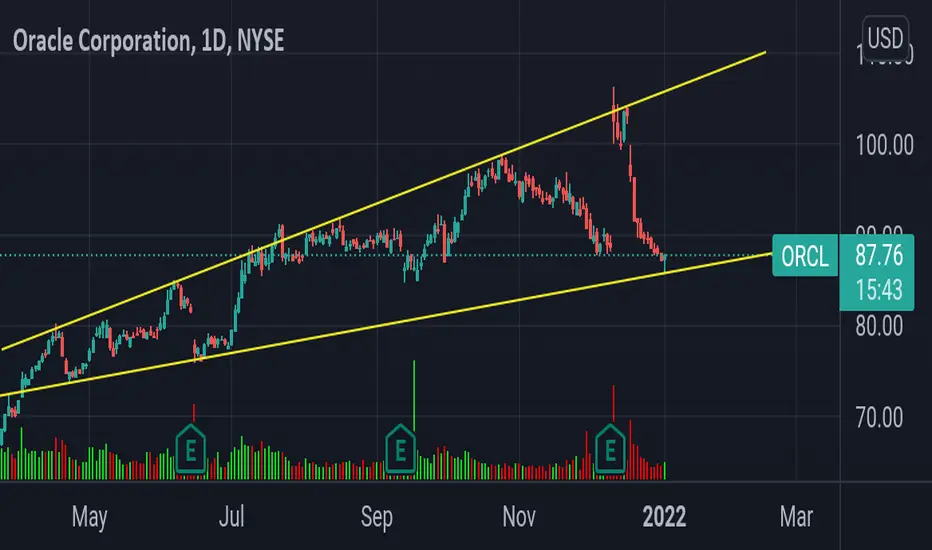
ORCL near termI'm waiting until after a small drop to about 84.50 which is where support appears to be, then long to about 95.50 or higher depending on it's personality at that point. Target might still be under and admittedly imperfect channel, but the bulls may bring it back into the channel. Considering the price action after earnings, could be a bit of a wild ride.

$ORCL Key Levels & Analysis $ORCL Key Levels & Analysis
No position here yet… but looking to targets 2-3 for a starting position as see where it goes from there…. Will update when I take a position…
——————
I usually trade both ways, but lately I’ve been focusing more to the downside because of how high the market is. It makes more sense to sell puts right now, and I’m usually at Target 2.
——————
I am not your financial advisor, but I will happily answer questions and analyze to the best of my ability but ultimately the risk is on you. Check out my ideas, but also do your own due diligence.
I am not a bull. I am not a bear. I just see what I see in the charts and I don’t pay too much attention to the noise in the news.
Very often you have to look at my charts from the perspective of where I’m looking to sell puts. But I also do open positions still once in a while.
If you want me to analyze any stock or ETF just leave me a comment and I’ll do it if I can.
Have fun, y’all!!
(\_/)
( •_•)
/ >🚀


$ORCL - Caught At Demand$ORCL has substantially cooled off after releasing a stellar earnings report, dropping a whopping 15%.
We currently sit at a demand zone for the company, with an additional level of support underneath.
This presents us with an awesome opportunity to long an awesome company at a deep discount, with little to no downside.

ORCL Monthly DemandLoving this ORCL play for the upside potential. Sellers are exiting the market due to the volume. Entering a demand zone.

Looks like a buy to meResults were really good
Investing in infrastructure
Cutting the cost of offices when most of the guys are working remotely also saves a lot of money

Oracle Bounce off 21EMA Friday but sold off on very high selling pressure even with it being quad witching.
50sma,Channel support and fibonacci level are both Align at 94.83.
If we fall below there Oracle will start to close its gap at 90$ . If we bounce at 95$ I'd wait for a bullish candlestick and go long for a leg higher.

ORCL Short Setup Not sure of the reason, may just be because it's over-extended. Or could be that they own Javascript which is the source of the huge hack that hit headlines today. Also was pushing 30 p/e..
(Opinion only)

Oracale USA Sun Storm Investment Trading Desk & NexGen Wealth Management Service Present's: SSITD & NexGen Portfolio of the Week Series
Focus: Worldwide
By Sun Storm Investment Research & NexGen Wealth Management Service
A Profit & Solutions Strategy & Research
Trading | Investment | Stocks | ETF | Mutual Funds | Crypto | Bonds | Options | Dividend | Futures |
USA | Canada | UK | Germany | France | Italy | Rest of Europe | Mexico | India
Disclaimer: Sun Storm Investment and NexGen are not registered financial advisors, so please do your own research before trading & investing anything. This is information is for only research purposes not for actual trading & investing decision.
#debadipb #profitsolutions

$ORCL - Watch for calls > 101.5 | puts < 100.2$ORCL - Watch for calls > 101.5 | puts < 100.2
- Daily inside bar formed

Oracle spikesOracle stock spikes after better than expected Q2 results. The CEO said the company’s fiscal 2022 revenue growth continues to accelerate from the 2021 level. The stock should reach to a new all time high after the opening bell, I think in the coming months Oracle should stay above the $100 mark.

ORCL best growth quarter since 2018Oracle (ORCL) reported revenue of $10.4 billion, up 6% growth YoY vs company’s guidance range of 3% to 5%.
Street consensus forecast was $10.2 billion.
ORCL quarterly earnings of $1.21 per share VS Consensus Estimate of $1.11 per share.
Earnings surprise of 9.01%.
My price target is 100usd, similar to Citigroup`s.

$ORCL Gap & Go candidate today!Keep an eye on $ORCL if it can push over the PM highs with power, it could be a Gap & Go candidate!

Oracle post earnings Really got this on wrong. In my previous you can see I had this Flag outlined and I thought we would see 100+ on a breakout but I discounted the pattern after the correction the market underwent. The type of 10% move that Oracle showed post market only comes from a pattern breakout.. Looks like the bull trend continues and the next target would be 105-108 which would be its channel top
