#OTIS #OTIS timeframe 1 day
Created a bullish Gartley pattern
Entry level around 93.50
Stop loss 90.00 ( estimated loss -2.56% )
First target at 97.43 ( estimated profit around 4.36% )
Second target 101.00 ( estimated profit around 8.25% )
NOTE : this data according to time frame I day
Its not an advice for investing only my vision according to the data on chart
Please consult your account manager before investing
Thanks and good luck
OTIS trade ideas


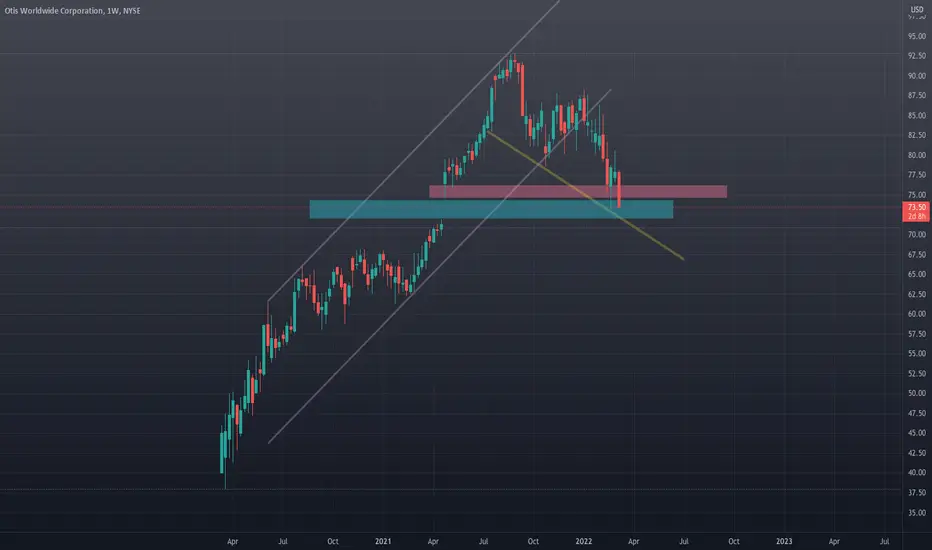
18/4/2022 NYSE (OTIS)Short (Entry Price) below the black line and exit (Stop Loss) above the red line. Can take profit at the suggested Target Price.
Entry Price: $75.38
Target Price: $74.26
Stop Loss: $76.50

Lift is breaking down $OTIS- Know when is the top
- Dont have to FOMO as there are millions and millions of set up / assets
- Identify the top
- Wait for price to go below 10/ 40
- Wait for formation to appear
- Very clean chart
- Break down uptrend support line
- Break down the support line
- Gap to fill
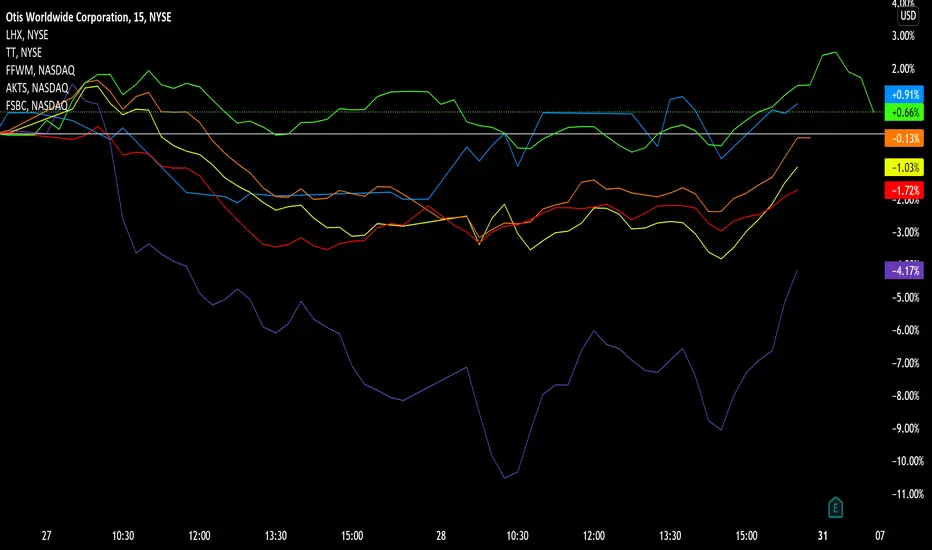
Earnings watch 1/31 pre-marketEarnings watch 1/31 pre-market:
OTIS
LHX
TT
FFWM
AKTS
FSBC
Do your own due diligence, your risk is 100% your responsibility. This is for educational and entertainment purposes only. You win some or you learn some. Consider being charitable with some of your profit to help humankind. Good luck and happy trading friends...
*3x lucky 7s of trading*
7pt Trading compass:
Price action, entry/exit
Volume average/direction
Trend, patterns, momentum
Newsworthy current events
Revenue
Earnings
Balance sheet
7 Common mistakes:
+5% portfolio trades, capital risk management
Beware of analyst's motives
Emotions & Opinions
FOMO : bad timing, the market is ruthless, be shrewd
Lack of planning & discipline
Forgetting restraint
Obdurate repetitive errors, no adaptation
7 Important tools:
Trading View app!, Brokerage UI
Accurate indicators & settings
Wide screen monitor/s
Trading log (pencil & graph paper)
Big, organized desk
Reading books, playing chess
Sorted watch-list
Checkout my indicators:
Fibonacci VIP - volume
Fibonacci MA7 - price
pi RSI - trend momentum
TTC - trend channel
AlertiT - notification
tickerTracker - MFI Oscillator
www.tradingview.com
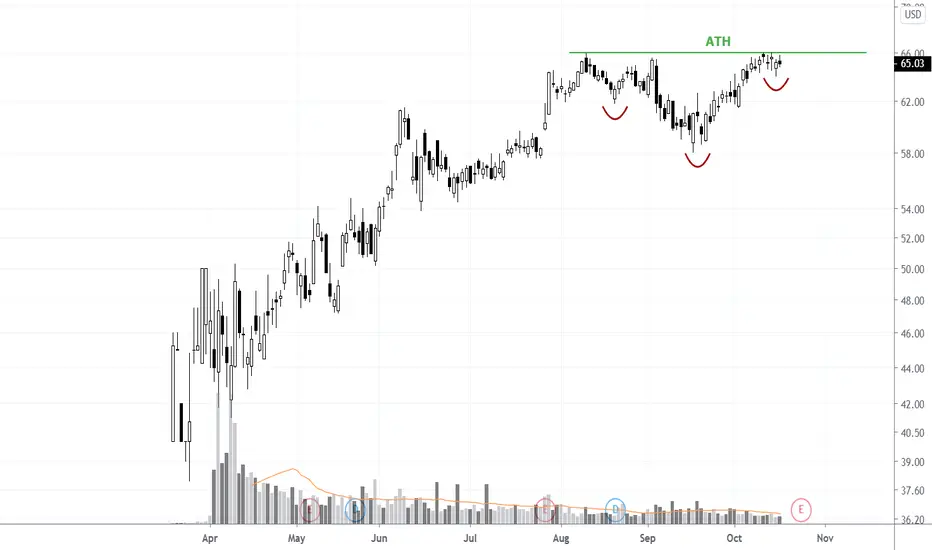
OTISOTIS is looking to breakout after months long bottoming with a inverse H&S. A break above the resistance a full measured move will take it to the ATH which will be a 6% gain.

Long OTISLong OTIS
Trend
Green = good
Otis Worldwide Corporation is an American company that develops, manufactures and markets elevators, escalators, moving walkways, and related equipment.

Buy OTIS 4/11/2021You can buy OTIS target 88.8 stop loss 77.25
Money management your responsibility.
I recommend entering a maximum of 10% of the portfolio.
Good luck

New long on OTISSolid fundamentals, good dividend, excess capital. This will be a dividend grower in the future. Looking to start with a 50% position at the denoted BZs.

the b[AI]te's weekly insights -- OTIS 2021-03-29center stage attention
stock
our system found that OTIS received most attention over the course of last week.
comment image
we see a weak negative correlation with our image indicator. We therefore assume that prices are driven by facts rather than emotions and reflect an accurate picture of the companies current state of affairs.
new free tool
we launched our new free analysis tool. Check our website and test it out!
new free and powerful data API
you can now access our data via our free API . Check our website and test it out!
FAQ
ATTENTION
our algorithms define ATTENTION as the overall number of stories and opinions that appear for a given security each day.
IMAGE
our algorithms define IMAGE as the averaged sentiment value extracted from all opinions received for a given security per day.

OTIS WORLDWIDE CORP Publication DailyHey tradingview community, OTIS WORLDWIDE CORP is in a fake downtrend with a slowdown in negotiated purchase volume and a kind of shooting star. Zooming in on the TIMEFRAME M1 we can see a marubozu with a low return of past sales volume. It goes on its last low point, reversing the trend to start testing the different points of the bollinger (base, higher) at the same time the VWAP and come back to recheck the top of the range (rectangle).
There is a good chance of breaking the price with an acceleration on the momentum at the same time the zone to go to the next one and get the next high. On the MULTI TIMEFRAME in lower unit (H4, H1) we find this high point and test of the neckline to be expected before breakout of a range to check the top of the fibonacci retracement. Otherwise it can be the breakage of the oblique support or go to the horizontal support.
Please LIKE & FOLLOW, thank you!

OTIS CONSOLIDATING UPWARDThis has been consolidating for a long time, the recent move up with analysts giving it a $77 P/T should be a good swing trade

bullish retest of a trendline of resistance turning to support. Otis is the leading provider of elevator technologies.
Otis will continue to grow and expand as long as they continue to improve customer value.
Urbanization in developing countries is bullish if they can compete on price and quality.

$OTIS 3 Months #HeadandShoulders Continuation #ChartPatternIndustrial Machinery sub-industry has multiple bullish chart setups forming. I have posted about $ITT last week and now $OTIS. The stock is forming a 3 month head and shoulders continuation pattern with neckline @ $66. That level has been tested multiple times. A breakout next week will push the stock into all time high territory!
Move Move Moveover all Bullish .
i have an impression this is a stock that can go up high and could have a lot of ups and downs.
:D :D :D
