PG&E CORP 1D BULL FLAGBull Flags are a Range patter & they are repeatable trading chart patterns.
Bull Flags are a descending chart pattern that will have a directional bias (Long) depending on the previous incoming trend.
Each chart pattern will have defining trendlines of the support/resistance levels creating the pattern.
What ever time frame you are trading this chart pattern, wait for a candle close outside of the trendline in the direction of the breakout candle. (Our time frame preference is the Daily chart).
Add volume indicator - Volume is the amount of $ that went into a particular candle or in Forex the # of trades that took place.
Add ATR indicator - Volatility is the amount of price movement that occurred. Use the ATR to measure the price movement.
When you see descending Volume bars and descending ATR line (which indicates volatility) this shows
a dis-interest in traders to invest in this pair creating consolidation which creates the chart pattern.
Trade Management after there is a breakout candle close.
1 - Position size (compare volume bar to volume ma line).
a - Breakout candle must be 100% of volume average for a full position size.
b - If 75% of volume average then ½ position size. (To find 75% of Volume
look at the charts volume settings – divide smaller # into larger # = 75%+)
If not 75% then stand aside from the trade.
2 – If candle breaks out of a trendline, 15m before the close of the day prepare your buy/sell order.
Enter two trades. 1st trade will have a SL & TP. It will close automatically when the 1st TP is hit. 2nd
trade only has a SL and will be allowed to run. When 1st TP is hit move the SL to breakeven. Look
at ATR and prepare SL at 1.5 of ATR. Prepare 1st trade TP at 1 of ATR.
3 - SL for both trades will be 1.5 x ATR.
4 - 1st trade TP will be 1 x ATR.
5 - No TP on 2nd trade – letting profit run and adjusting SL to follow price.
6 - When 1st TP hit – move 2nd trade SL to breakeven.
7 - Adjust the 2nd trade SL to follow price.
*8 – After Breakout candle – if price closes back into chart pattern close trade don't wait for SL to be hit.
*9 - When breakout candle is more than 1 ATR from breakout candle open.
a - Enter 1st trade at candle close with ½ position size.
b - Enter 2nd trade with a pending limit order that is 1 ATR of breakout candle open.
c – Price should pullback to that pending limit order for 2nd trade.
d – If Price returns back into chart pattern close trade before SL is hit.
PCG trade ideas

PCG Long EMA50 crossed EMA200, Uptrend Confirmation
EMA50/200 as support zone
Wedge Consolidation
Entry 12
Stop 11
Target1 15
Target2 18
I am not a PRO trader. I trade option to test my trading plan with small cost.
The max Risk of each plan is less than 1% of my account.
If you like this idea, please use SIM/Demo account to try it.


BUY PACIFIC GAS & ELECTRIC| [$5PCG] | 12.19.2020Set up: Wave 1 near completion
Target 1: 15
Target 2: 20
All my ideas are for education purposes. There is a high-degree of risks involving leverage trading. Trade at your own risk. This is not financial advice.


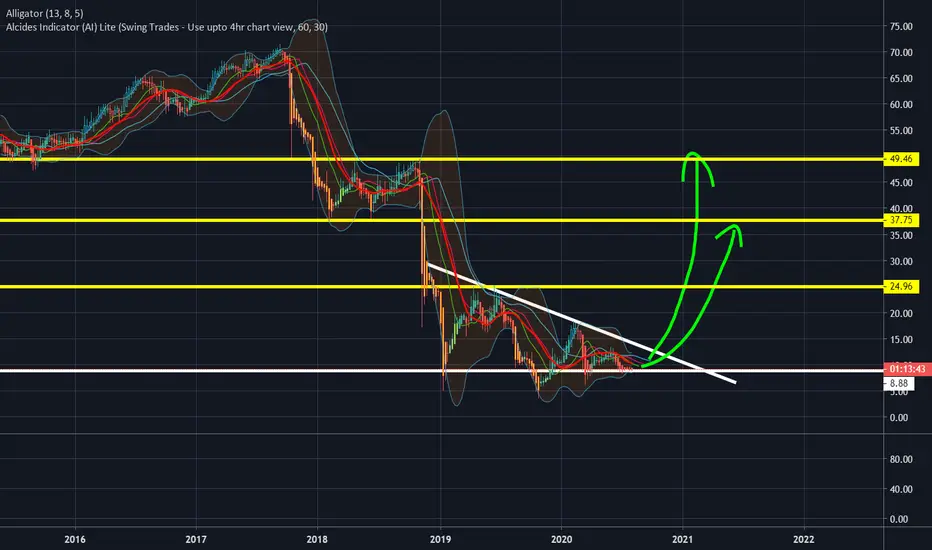
PCG Post Bankruptcy MarkupAfter trading in a tightening range for the past year PCG has an approved plan to exit bankruptcy and may even resume dividends in time. Utilities are always a good way to diversify a portfolio. My average entry price is in the $9.30 range. Analysts price targets are near $14, i'm a bit more bullish with a near term just north of $14 and $30 near this time next summer. Lets see how high the rising tide lifts this boat.


PCG Swing ideaPCG swing I played from 8.9 to 10.5 zone. Ultimately looking for a rounded cup on this. 13 target in sights. ER coming up 10/29 so watch accordingly.

PCG long swing 12 dollar price targetTime to fill some gap on pcg, the squeeze from the long swing I been waiting for has come. Speed bump zone at 10.01-10.50


guard those electrical lines from saccome on pg&e im with you.. watch out for governer newsomes henchman starting fires ac-crossed the state. as a local we dont get fires til october
when santa anas winds arrive. they just want your assets bunch of loosers!

TriangleBreakdown of triangle has occurred. Target is ~2. The larger pattern is an expanding triple zigzag. Once this completes, I think that may be a good buy point if company is still viable.