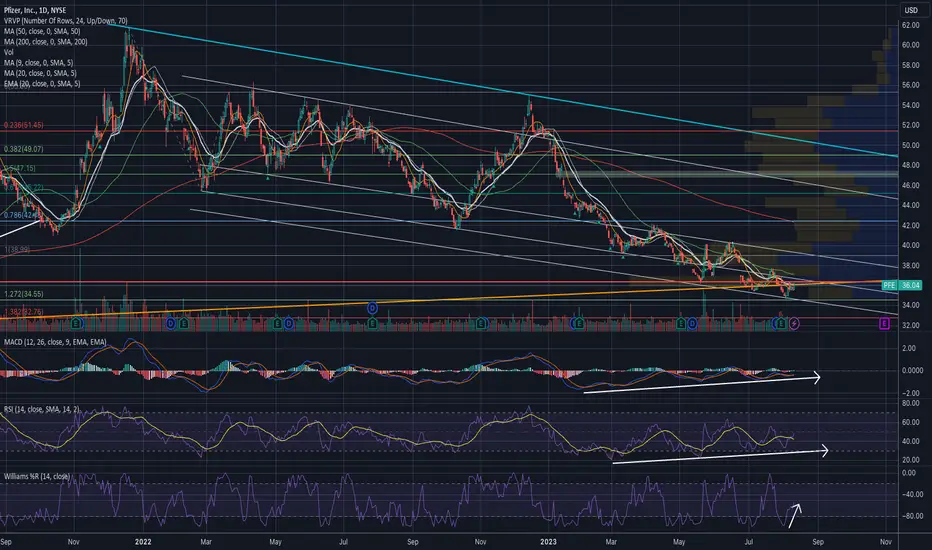
PFE looking interestingPfizer is looking interesting from multiple perspectives. Long-term support region. Diagonal from prior cycle lows. Multiple drives of bull divs. Between the 0.618 and 0.702 fibs on the log scale. Will it get a bounce?
PFE trade ideas

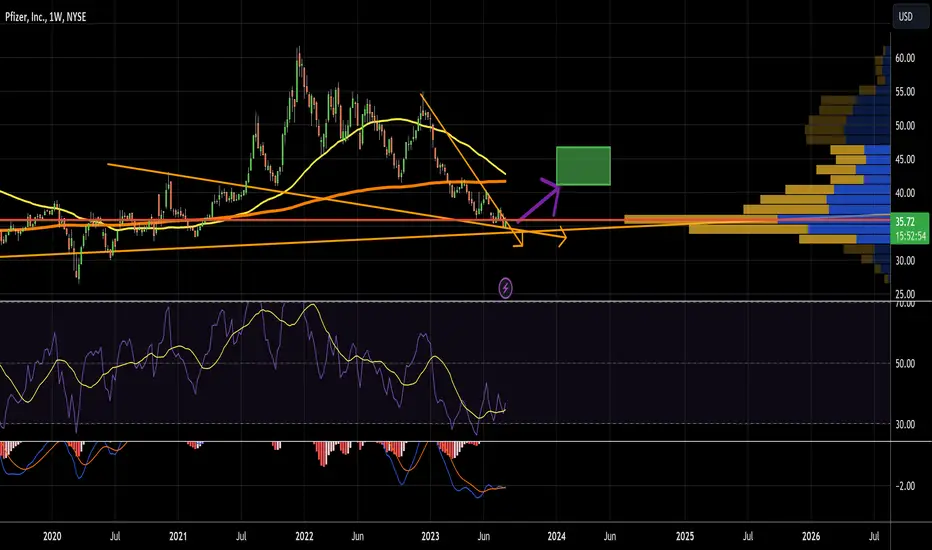
Pfizer at HUGE support. New Pandemic?On the monthly chart, Pfizer looks to continue it's push upwards towards higher highs as it currently is losing downwards momentum illustrated by the bullish RSI divergences while it gets closer towards the bottom prices channel support as well as the volume profile point of control.
COVID 2.0 incoming?

Pfizer ($PFE) LongPFE finally breaking above the 20 and 50 day moving averages. 200 day is a bit of a reach at 41 with a big resistance level at 37.5 and 39.5. The 9/1 37.5C traded over 21,000x today. Target = 39-40

PFE, 10d+/-9.19%falling cycle -9.19% more than 10 days.
==================================================================================
This data is analyzed by robots. Analyze historical trends based on The Adam Theory of Markets (20 moving averages/60 moving averages/120 moving averages/240 moving averages) and estimate the trend in the next 10 days. The white line is the robot's expected price, and the upper and lower horizontal line stop loss and stop profit prices have no financial basis. The results are for reference only.

PFE setting up for a move. We are starting a pattern of an island bottom. (Patterns are probabilities until proven correct) As of now we are holding a bullish monthly rsi divergence. Also showing bullish divergences on daily weekly and shorter time frames. The Oi for 9/15 is also loaded. The TA is pointing to PFE brewing something in the pipe line. I would suspect some kind of bullish headline for the stock soon. I think I will be looking for a target of $40. I will be scaling in and out during the process. Still early on this one but just wanted to put it out there. This is just DD not trading advice.

$PFE - could be bottomingNYSE:PFE #Pfizer could be forming a bottom as it shows bullish divergences on MACD and RSI. The William's Percentage Range has exited the oversold zone.
Closing above $37 would indicate a bullish trend, while breaking below $34 would suggest a bearish scenario.
Potential targets - $37, $38, $40, and $42
Downside risk - $34.
$PFE yieahhAnother pharma about to explode?
If we vreak the wedge we can expect $40s.
MACD and RSI curling on Weekly
Yieahh
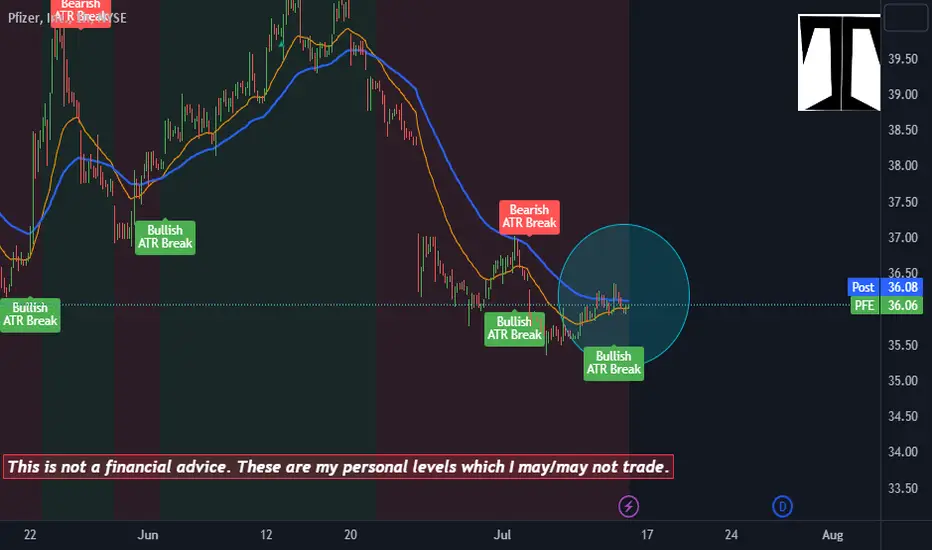
Bullish Alert : PFEHourly Chart.
The price is still moving into a downtrend, but right now there is a new bullish alert with a bullish test of our EMAs. These scenario is working nearby the trendline which may end-up in a breakout.
Waiting for positive price action in the short term.

PFE | Is this the Bottom? | LONGPfizer Inc. discovers, develops, manufactures, markets, distributes, and sells biopharmaceutical products worldwide. It offers medicines and vaccines in various therapeutic areas, including cardiovascular metabolic, migraine, and women's health under the Eliquis, Nurtec ODT/Vydura, and the Premarin family brands; infectious diseases with unmet medical needs under the Prevnar family, Nimenrix, FSME/IMMUN-TicoVac, and Trumenba brands; and COVID-19 prevention and treatment, and potential future mRNA and antiviral products under the Comirnaty and Paxlovid brands. The company also provides medicines and vaccines in various therapeutic areas, such as biosimilars for chronic immune and inflammatory diseases under the Xeljanz, Enbrel, Inflectra, Eucrisa/Staquis, and Cibinqo brands; amyloidosis, hemophilia, endocrine diseases, and sickle cell disease under the Vyndaqel family, Oxbryta, BeneFIX, and Genotropin brands; sterile injectable and anti-infective medicines under the Sulperazon, Medrol, Zavicefta, Zithromax, Vfend, and Panzyga brands; and biologics, small molecules, immunotherapies, and biosimilars under the Ibrance, Xtandi, Inlyta, Retacrit, Lorbrena, and Braftovi brands. In addition, the company is involved in the contract manufacturing business. It serves wholesalers, retailers, hospitals, clinics, government agencies, pharmacies, individual provider offices, retail pharmacies, and integrated delivery systems, as well as disease control and prevention centers. The company has collaboration agreements with Bristol-Myers Squibb Company; Astellas Pharma US, Inc.; Myovant Sciences Ltd.; Merck KGaA; Valneva SE; BioNTech SE; and Arvinas, Inc., as well as strategic partnership with CSPC Pharmaceutical Group Limited to launch a local brand of the COVID-19 oral therapeutic treatment Nirmatrelvir/Ritonavir in China, and a collaboration with Carrick Therapeutics Limited. Pfizer Inc. was founded in 1849 and is headquartered in New York, New York.

Pfizer, Inc. NYSE - dailyPrice is approaching monthly Demand zone.
There are chances price will go up after hitting daily demand zone nested in monthly supply zone

$PFE good sleeper bullish above 32NYSE:PFE with 32 as SL (above 32) it can be a good sleeper targeting towards 53 to 59 and 66 -dydd
If it goes like a turtle looking at $62 which is 100 % by June 2025

Bearish Alert : PFEThe 15 minutes see a new bearish alert after a nice impulse wave.
The price already moved lower at $36.8 after the bearish crossover.
On Watch for a possible breakout of the level.

PfeBigger picture is the broadening wedge Here
Smaller picture is the falling wedge
Both are bullish
I think we will have a push up to 40 in the next 2 weeks , once Pfe breaks 40 the next target is resistance

Unveiling the Potential of Pfizer Pharmaceutical Stock in 2023Are you searching for a lucrative investment opportunity that promises great returns in 2023? Look no further as we unveil the hidden potential of Pfizer Pharmaceutical stock. In this blog post, we will delve into the compelling reasons why investing in Pfizer is not only a smart move but also an incredibly exciting. From groundbreaking innovations to robust financial performance, join us as we explore why Pfizer is poised to be a game-changer in the pharmaceutical industry and how you can reap substantial rewards by including it in your investment portfolio. Don’t miss out on this exclusive insight into what could be your most profitable venture yet!
Monthly price action is supporting a strong bullish correction in the following months. Pfizer is one of the world’s leading pharmaceutical companies and was at the forefront of developing a vaccine for Covid-19 in 2020. The stock price reflected the impact of the vaccine until December 2021, when the stock plunged, losing almost 50% of its value. It’s then when a longer-term demand imbalance takes control and helps us make a high-probability decision to buy and hold shares of Pfizer PFE stock.

Bullish Alert : PFEHourly Chart
New Bullish alert with negatie price action.
The ema 21 is on its way to cross the ema 50.
Still waiting for a combo for a topSwing
Swing Trading Pfizer $PFE on bottom Elliottwave patternPfizer is trading at the end of an Elliottwave 5th wave pattern.
This market price level is a low risk entry for longs, because it could be the end of a relative long midterm pullback

Good place to DCA inIf you wanting to get into pharma, here is a good place to start a DCA into PFE.
On the daily we have bullish divergence on RSI and OBV looking good as well.
Combine that with a long term pivot price level from 2016 and a diagonal, this may well be the spot. Perhaps just missing a bottoming tail....

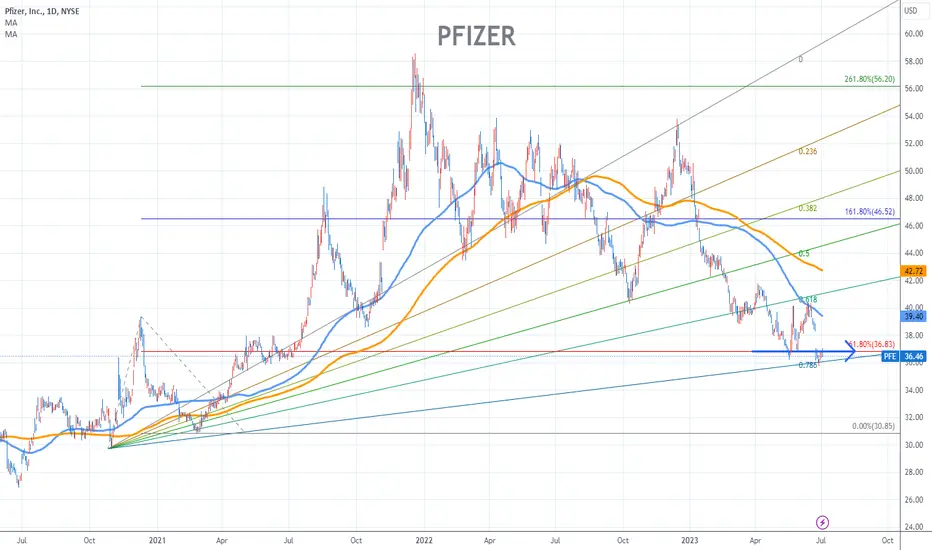
PFIZER Stock Chart Fibonacci Analysis 070523 Trading Idea
1) Find a FIBO slingshot
2) Check FIBO 61.80% level
3) Entry Point > 36.8/61.80%
Chart time frame : D
A) 15 min(1W-3M)
B) 1 hr(3M-6M)
C) 4 hr(6M-1year)
D) 1 day(1-3years)
Stock progress : C
A) Keep rising over 61.80% resistance
B) 61.80% resistance
C) Hit the bottom
D) Hit the top
Stocks rise as they rise from support and fall from resistance. Our goal is to find a low support point and enter. It can be referred to as buying at the pullback point. The pullback point can be found with a Fibonacci extension of 61.80%. This is a step to find entry level. 1) Find a triangle (Fibonacci Speed Fan Line) that connects the high (resistance) and low (support) points of the stock in progress, where it is continuously expressed as a Slingshot, 2) and create a Fibonacci extension level for the first rising wave from the start point of slingshot pattern.
When the current price goes over 61.80% level , that can be a good entry point, especially if the SMA 100 and 200 curves are gathered together at 61.80%, it is a very good entry point.
As a great help, tradingview provide these Fibonacci speed fan lines and extension levels with ease. So if you use the Fibonacci fan line, the extension level, and the SMA 100/200 curve well, you can find an entry point for the stock market. At least you have to enter at this low point to avoid trading failure, and if you are skilled at entering this low point, with fibonacci6180 technique, your reading skill to chart will be greatly improved.
If you want to do day trading, please set the time frame to 5 minutes or 15 minutes, and you will see many of the low point of rising stocks.
If want to prefer long term range trading, you can set the time frame to 1 hr or 1 day.
PFE oversold and could be good buyIt looks like PFE is one of the few large cap stocks as of 7/4/23 that has a RSI under 40. Could be a good swing trade to hold PFE for a few days to a couple of weeks for a nice percentage gain.

Pfizer to stall at major resistance?Pfizer - Medium Term - We look to Sell at 39.88 (stop at 41.08)
Bespoke resistance is located at 40.
40.14 has been pivotal.
40.37 has been pivotal.
Daily signals are bearish.
We look for a temporary move higher.
Our profit targets will be 37.08 and 36.58
Resistance: 37.05 / 38.30 / 39.00
Support: 36.03 / 35.50 / 35.00
Please be advised that the information presented on TradingView is provided to Vantage (‘Vantage Global Limited’, ‘we’) by a third-party provider (‘Everest Fortune Group’). Please be reminded that you are solely responsible for the trading decisions on your account. There is a very high degree of risk involved in trading. Any information and/or content is intended entirely for research, educational and informational purposes only and does not constitute investment or consultation advice or investment strategy. The information is not tailored to the investment needs of any specific person and therefore does not involve a consideration of any of the investment objectives, financial situation or needs of any viewer that may receive it. Kindly also note that past performance is not a reliable indicator of future results. Actual results may differ materially from those anticipated in forward-looking or past performance statements. We assume no liability as to the accuracy or completeness of any of the information and/or content provided herein and the Company cannot be held responsible for any omission, mistake nor for any loss or damage including without limitation to any loss of profit which may arise from reliance on any information supplied by Everest Fortune Group.


Bullish Alert : PFEDaily Chart, Finally the price started to trade above the ema 50d
Bullish Alert came out after a new positive price action at $40.40.
Waiting for a bullish crossover and positive price action as last move.
PFE Wave 5 seems to be over. We have to wait little by little for the price of the main wave to drop.
