PFE trade ideas

PFE into major SupportPfizer may provide a great risk to reward setup. Multi factor trade setup on pfizer likely sees a technical bounce. Keep in mind markets are weak.

earnings estimateas pandemic is slowering and chinese lockdown vix is going down stocks like pie healthcare can come down from their highs

Pharmaceutical Reversal?NYSE:PFE NYSE:ABBV will be on my watchlist next week.
Let's start with Pfizer first.
Pfizer has been down since mid of December 2022.
And now it is on interesting area (see on the chart)
In my view, area of $ 42.74 to $ 43.52 will be critical.
Next week Pivot Point will be at $ 44.24, if the price can stand above its weekly Pivot Point then a potential reversal may occur.
If we look at the weekly chart, EMA200 Weekly has been survived by the last downfall of PFE on October 2022.
MACD have shown a small bullish divergence.
Maybe an Earning Report can boost NYSE:PFE chart for next week.
Let's see.

$PFE - Oversold. Possible seller exhaustion#Pfizer has been oversold for some time. Today's gap down on UBS downgrade could be the seller exhaustion and potential bounce to come.
Target 1 - $46.5
Target 2 - $47.67
Target 3 - $51
Long term - $60
Risk - fall to $41.
——
Trade is done when it hit one of the target or stop loss is hit.
Disclaimer: Trading note. Not an investment advice.

$PFE: Interesting juncture here...Pfizer has a curious setup where both an uptrend or down trend could trigger next, depending on which extreme of last week's range is crossed first.
As per the chart, you can go long on a break of last week's high or short on a break of last week's low, with stops as depicted on chart. Targets may be subject to updates, if price action forms larger consolidation patterns in the direction of the trade and the initial entry isn't stopped. Odds of the trade working and making some progress in the next week are big if the trade is triggered, you could secure some gains by Friday close, if the target or the stop aren't hit, or just exit the trade altogether to revisit it next week, if continuation occurs.
Best of luck!
Ivan Labrie.

Potential 2-1-2 daily setupsPFE - failed 2u-1 on the daily, looking for more downside tomorrow. Put Trigger below 44.83. Put SL/Call trigger set at 45.32
JNJ - has a 2-1- on the daily. Feeling neutral but would prefer downside on this play. Call trigger above 169.62, Put trigger below 167.50. JNJ has earnings report tomorrow so be careful trading this one. (SL for call and put trigger is the other trigger)
HTHT - failed 2u-1 on the daily. Big gap to the downside on the daily. Only looking at puts below 48.06. SL above 48.95

PFE | Good Starter Position Entry | LONGPfizer Inc. discovers, develops, manufactures, markets, distributes, and sells biopharmaceutical products worldwide. It offers medicines and vaccines in various therapeutic areas, including cardiovascular metabolic and women's health under the Premarin family and Eliquis brands; biologics, small molecules, immunotherapies, and biosimilars under the Ibrance, Xtandi, Sutent, Inlyta, Retacrit, Lorbrena, and Braftovi brands; and sterile injectable and anti-infective medicines, and oral COVID-19 treatment under the Sulperazon, Medrol, Zavicefta, Zithromax, Vfend, Panzyga, and Paxlovid brands. The company also provides medicines and vaccines in various therapeutic areas, such as pneumococcal disease, meningococcal disease, tick-borne encephalitis, and COVID-19 under the Comirnaty/BNT162b2, Nimenrix, FSME/IMMUN-TicoVac, Trumenba, and the Prevnar family brands; biosimilars for chronic immune and inflammatory diseases under the Xeljanz, Enbrel, Inflectra, Eucrisa/Staquis, and Cibinqo brands; and amyloidosis, hemophilia, and endocrine diseases under the Vyndaqel/Vyndamax, BeneFIX, and Genotropin brands. In addition, the company is involved in the contract manufacturing business. It serves wholesalers, retailers, hospitals, clinics, government agencies, pharmacies, and individual provider offices, as well as disease control and prevention centers. The company has collaboration agreements with Bristol-Myers Squibb Company; Astellas Pharma US, Inc.; Myovant Sciences Ltd.; Akcea Therapeutics, Inc; Merck KGaA; Valneva SE; BioNTech SE; and Arvinas, Inc. Pfizer Inc. was founded in 1849 and is headquartered in New York, New York.

PFE set back a good opportunityWe think the current setback provides a nice opportunity to buy some PFE with a nice dividend and decent ROE, for a move back into the low-to-mid fifties.


PFIZER could rise despite recent fallWe could see a rise in PFE's price in the next few weeks up to the $54.5 range, however, estimates for the Q4 22 earnings is lower then the previous quarter, if the price does not crash following the earnings, or perhaps if the earnings were positive, the price would likely rise, however it is best in this current state to only take small trades and play around with rather short swing trades.

Pfizer BullishThe Chart currently shows Bullish signal as per these indicators:
1. Bullish Falling Wedge Chart Pattern
2. Bullish Divergence ( RSI )
If the upper trendline is broken can expect further upside potential.

Pfizer in a bull flag.Pfizer - 30d expiry - We look to Buy a break of 48.31 (stop at 46.56)
Short term bias has turned positive.
Posted a bullish Flag formation.
A break of 48.26 is needed to confirm the outlook.
A break of the recent high at 48.26 should result in a further move higher.
Short term momentum is bullish.
This stock has seen good sales growth.
The bias is to break to the upside.
Our profit targets will be 52.69 and 53.69
Resistance: 48.00 / 49.70 / 52.00
Support: 46.70 / 46.00 / 44.70
Disclaimer – Saxo Bank Group.
Please be reminded – you alone are responsible for your trading – both gains and losses. There is a very high degree of risk involved in trading. The technical analysis , like any and all indicators, strategies, columns, articles and other features accessible on/though this site (including those from Signal Centre) are for informational purposes only and should not be construed as investment advice by you. Such technical analysis are believed to be obtained from sources believed to be reliable, but not warrant their respective completeness or accuracy, or warrant any results from the use of the information. Your use of the technical analysis , as would also your use of any and all mentioned indicators, strategies, columns, articles and all other features, is entirely at your own risk and it is your sole responsibility to evaluate the accuracy, completeness and usefulness (including suitability) of the information. You should assess the risk of any trade with your financial adviser and make your own independent decision(s) regarding any tradable products which may be the subject matter of the technical analysis or any of the said indicators, strategies, columns, articles and all other features.
Please also be reminded that if despite the above, any of the said technical analysis (or any of the said indicators, strategies, columns, articles and other features accessible on/through this site) is found to be advisory or a recommendation; and not merely informational in nature, the same is in any event provided with the intention of being for general circulation and availability only. As such it is not intended to and does not form part of any offer or recommendation directed at you specifically, or have any regard to the investment objectives, financial situation or needs of yourself or any other specific person. Before committing to a trade or investment therefore, please seek advice from a financial or other professional adviser regarding the suitability of the product for you and (where available) read the relevant product offer/description documents, including the risk disclosures. If you do not wish to seek such financial advice, please still exercise your mind and consider carefully whether the product is suitable for you because you alone remain responsible for your trading – both gains and losses.

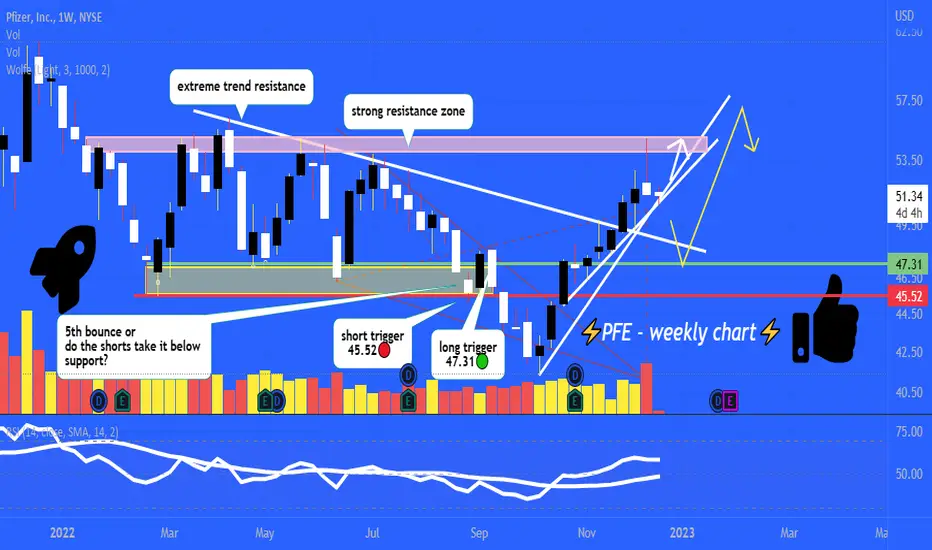
push to resistance zone coming? 👀nice break past long trigger/trend resistance, if we can hold local trend supports a push to resistance zone is possible by end of year/early 2023
boost and follow for more 💛
PFE longWednesday morning, Pfizer unveiled its Q2 figures. They revealed that the pharmaceutical sector giant earned revenue of $19 billion, a robust 86% higher than in the same quarter of 2020. Much of this was, of course, due to the BNT162b2 coronavirus vaccine it's developed with Germany-based BioNTech. But even stripping out the vaccine's sales from the top line, the company still managed to grow revenue by 10% to $11.1 billion. On average, analysts tracking Pfizer stock were modeling $18.45 billion.
Quoted by the company as saying the quarter was "remarkable," CEO Albert Bourla signaled optimism for the coming years. He and his troops believe Pfizer will be able to hit a 6% compound annual revenue growth rate through 2025.
With that powerful quarter behind it, the confident Pfizer has upped its full-year guidance. It now expects $78 billion to $80 billion in revenue (previous estimate: $70.5 billion to $72.5 billion), and adjusted diluted per-share earnings of $3.95 to $4.05 (up from $3.55 to $3.65).


Breakout resumes for Pfizer after testing supportNYSE:PFE broke out at 45.60 and after hitting a high of 58, it then retested support in Oct 2022. It has now broken out and is heading higher.

$PFE looking for reversal$PFE moved with news yesterday. Looking for a reversal down back to support area $50 area

PFE (Range Trade)Since the recent news relative to the authorization this past week, price has been making higher highs and lower lows. Only 6 times this year price played around in the $54 -$56 area. I'm banking on price exhaustion from the recent "good" news this past week. Daily is overbought as well. Maybe we can get a bar close or two this week lower than previous to give us some time. If price reaches this resistance area, we will reassess Might wait til the fed decision and cpi reports pass next week to get a second look.

PFIZER Broke above its 2022 Bear Channel!Pfizer (PFE) broke and closed today above the Channel Down that has been dominating the 2022 Bear Market since the January 11 High. At the same time the 1D RSI has been ranging and while the 1D MA200 (orange trend-line) held successfully last time, we do expect one last test or for an even more comfortable long-term buy, the 1D MA50 (blue trend-line).
As you may notice, the Fibonacci retracement levels since the All Time High, formed solid Resistance and Support levels during the downtrend, so after the next pull-back our target will by the 0.786 Fib at 57.35.
-------------------------------------------------------------------------------
** Please LIKE 👍, SUBSCRIBE ✅, SHARE 🙌 and COMMENT ✍ if you enjoy this idea! Also share your ideas and charts in the comments section below! This is best way to keep it relevant, support me, keep the content here free and allow the idea to reach as many people as possible. **
-------------------------------------------------------------------------------
You may also TELL ME 🙋♀️🙋♂️ in the comments section which symbol you want me to analyze next and on which time-frame. The one with the most posts will be published tomorrow! 👏🎁
-------------------------------------------------------------------------------
💸💸💸💸💸💸
👇 👇 👇 👇 👇 👇


PfizerFalling Wedge Pattern Breakout; Retest in progress (wait for HL formation)
Formation of HH and HL (Dow Theory; Bullish trend)
Support from 61% fib retracement
Entry after formation of HL (50.5)
Trade with specified Stop Loss
TP levels are specified
Ride the trend with trailing stop Loss
Manage your risk accordingly

PFE, 10d+/13.88%rsing cycle 13.88% more than 10 days.
==================================================================================================================================================================
This data is analyzed by robots. Analyze historical trends based on The Adam Theory of Markets (20 moving averages/60 moving averages/120 moving averages/240 moving averages) and estimate the trend in the next 10 days. The white line is the robot's expected price, and the upper and lower horizontal line stop loss and stop profit prices have no financial basis. The results are for reference only.
